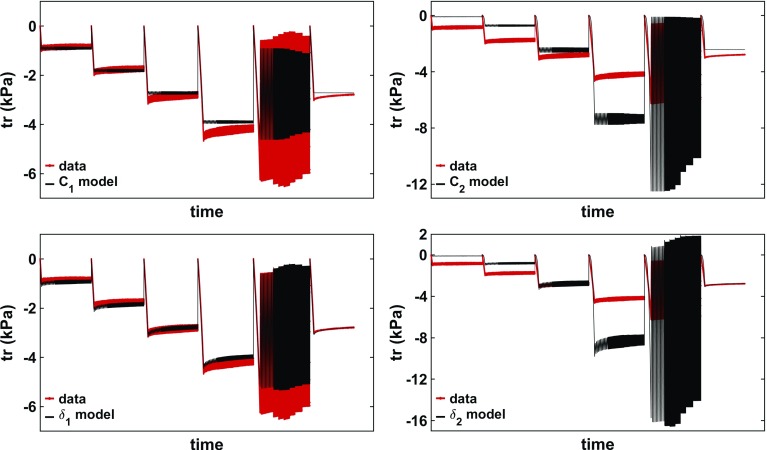
Fig. 7.
Contribution of each parameter to the model (black) compared to the data (red) (here, in phantom 4). Each of the four linear parameters ( (top left), (top right), (bottom left), (bottom right)) was fit to the data, while setting the other 3 to be 0 ( was kept constant at 0.03). In each quadrant, the traction is depicted along the y-axis and the time along the x-axis (waiting times between tests not plotted for convenience). The parameters and errors can be seen in Table 2

