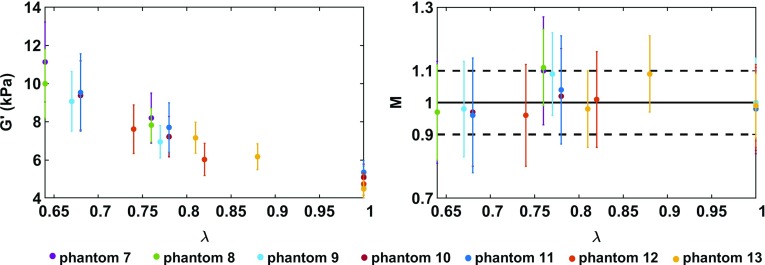
Fig. 9.
Average of stiffness maps and corrected maps M over all pixels in a phantom (excluding boundaries), in all deformation states. (Left) Average of stiffness map obtained using UR (Eq. 9) on the MRE data. In undeformed state, when , the average stiffness of the phantoms lies within 4.5-5.3 kPa. With increased compression, the phantoms appear to be stiffer, following a nonlinear trend. (Right) Average of corrected maps M, obtained by employing CR (Eq. 22) on the MRE data. The average value of the corrected maps M spans between 0.96 and 1.11. The standard deviation for all phantoms in all compression states cross the line at the ideal value

