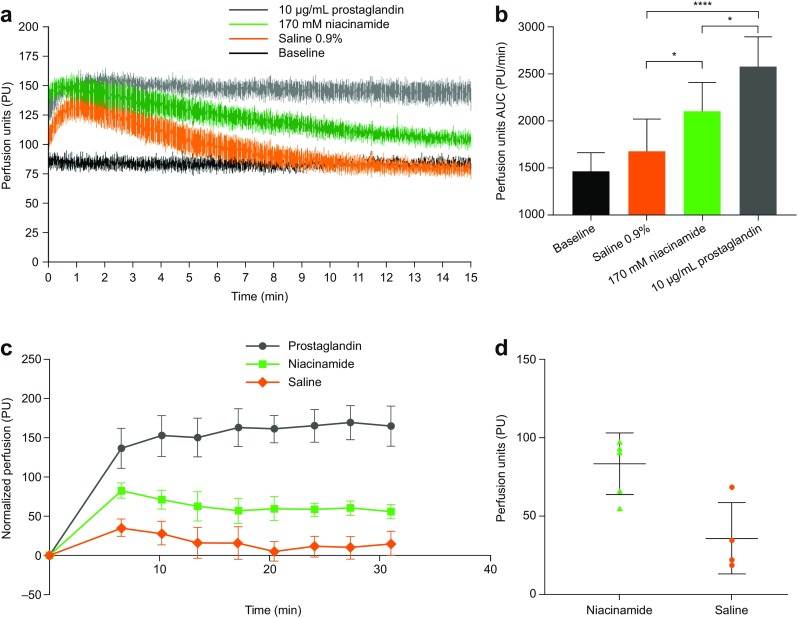
Fig. 8.

LASCA and LDI of skin perfusion in pigs after subcutaneous administration of saline, niacinamide and prostaglandin formulations. (a) LASCA perfusion recordings for each of the three formulations (also see supplementary video of LASCA). (b) LASCA AUC calculations during the 0–15 min interval. n=4; *p≤0.05; ****p≤0.00001. (c) Normalized LDI profiles presented as mean±SEM, n=4. (d) Comparison of perfusion between niacinamide and saline 6.53 min after injection presented as mean±SD, n=4; p<0.02. AUC, area under the curve; LASCA, laser speckle contrast analysis; LDI, Laser Doppler imaging; SD, standard deviation; SEM, standard error of the mean.
