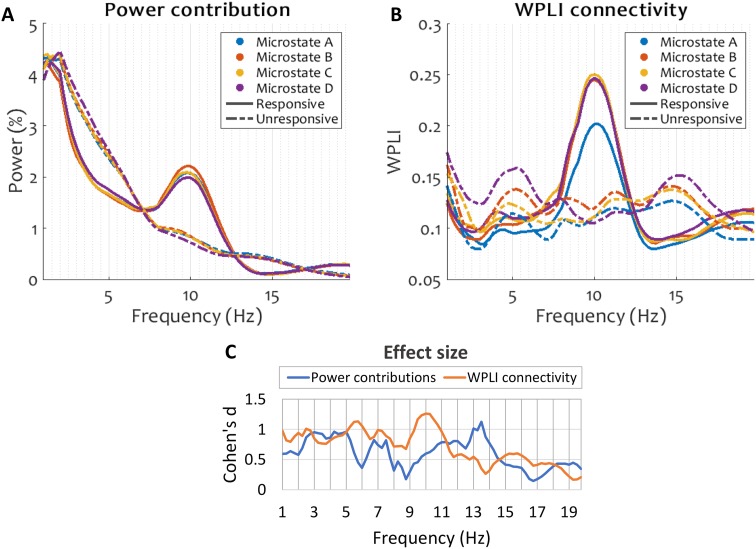
Fig. 6.
Spectral power (a) and WPLI connectivity (b) captured during individual microstates before and after loss of responsiveness due to drowsiness. Channel-wise relative power at each frequency bin was calculated as the power at that bin as a percentage of total power within 1–20 Hz. Within each subject, for both relative power and WPLI connectivity, the median across channels is plotted. Figures show the grand average over all subjects. c Shows the effect size, computed as Cohen’s d, of the interaction between behavioural state and microstate at each frequency bin for power contributions and for connectivity. By convention, 0.2, 0.5 and 0.8 denote small, medium and large effect sizes, respectively. The interaction between microstate and behavioural state was stronger in connectivity than in power

