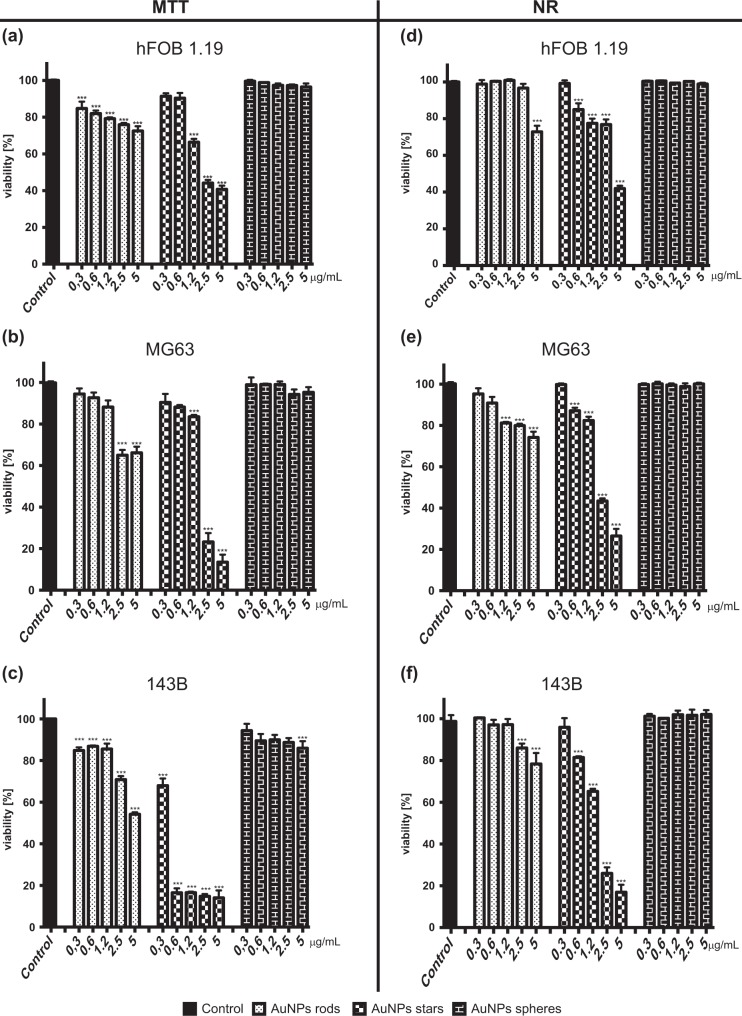
Fig. 3.
Different shapes of AuNPs decreased cell viability in a concentration-dependent manner. Viability, measured by MTT test, of a hFOB1.19 cells, b MG-63, c 143B cells exposed to different shapes of AuNPs after 24 h. Viability, measured by NR test, of d hFOB1.19 cells, e MG-63, f 143B cells exposed to different shapes of AuNPs after 24 h. Data are presented as mean ± SD. *p < 0.05, **p < 0.01, ***, p < 0.001

