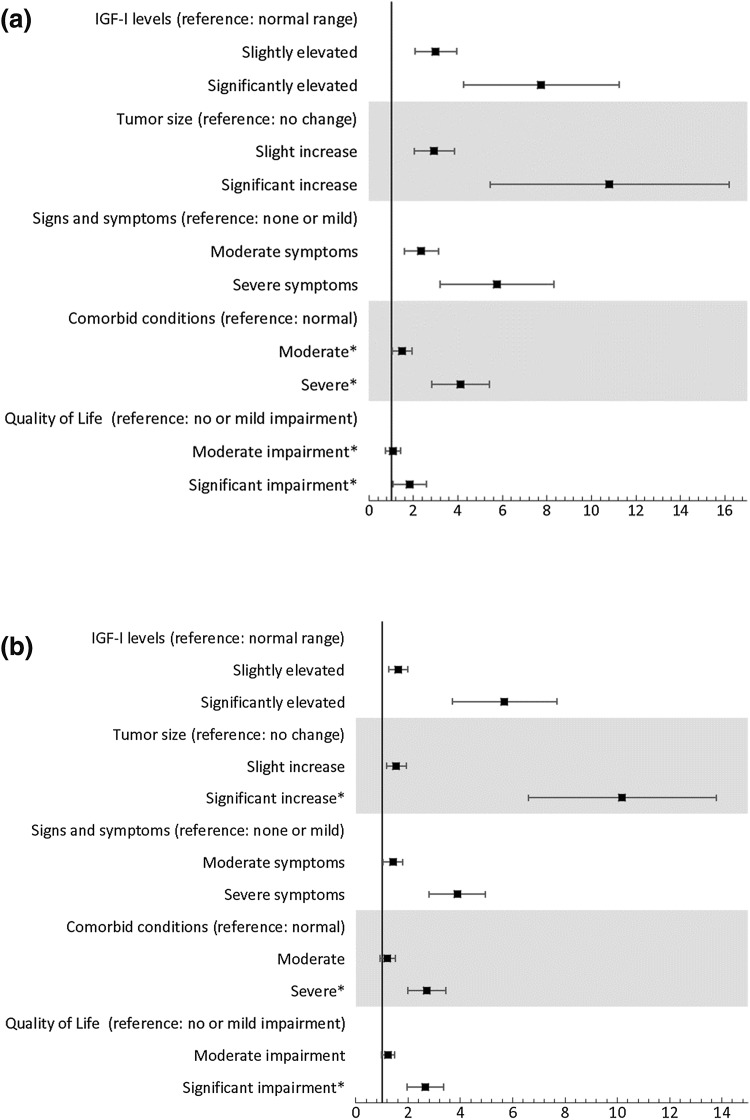
Fig. 1.
Single-profile choice task regression results: a predicting participant assessments of mild disease activity or significant disease activity (compared to stable); and b predicting participant assessments of significant disease activity (compared to mild disease activity). Odd Ratios (ORs) with 95% confidence interval (CI) are shown on the horizontal axes. Note: An OR above 1 indicates that participants were more likely to choose more severe disease activity when the parameter level of interest was shown. In this figure, the blocks represent the mean OR, and the brackets span the 95% Confidence interval. A disease parameter level has a significant impact on choices if the 95% CI does not cross zero. aThe survey used patient-friendly language which described “comorbid conditions” as “related conditions” and “signs and symptoms” as “symptoms”. *OR significantly different from the IGF-I disease parameter for the same attribute level

