Fig. 3.
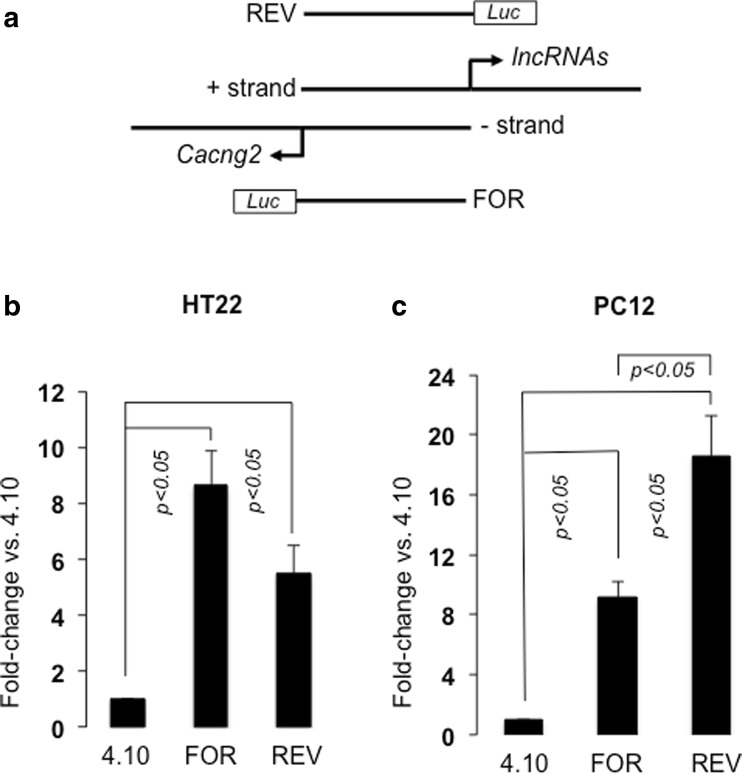
Bidirectional activity of the Cacng2 promoter activity in transfected HT22 and PC12 cells. a Schematic representation (not scaled) of the Cacng2 locus illustrating the “head-to-head” organization of Cacng2-coding, and lncRNA(s) sequences in the rat genome, and the forward- (FOR) and reverse-orientation (REV) constructs used in the experiments. b, cCacng2 sequences were cloned within pGL4.10, transfected into either b HT22 or c PC12 cells, and levels of expression (fold-change relative to empty pGL4.10) were determined by luciferase (Luc) assays. p < 0.05 indicates statistically significant difference between different groups as determined by ANOVA and post hoc analysis (see text). The data are expression levels of constructs (mean ± S.E., n = 6/group)

