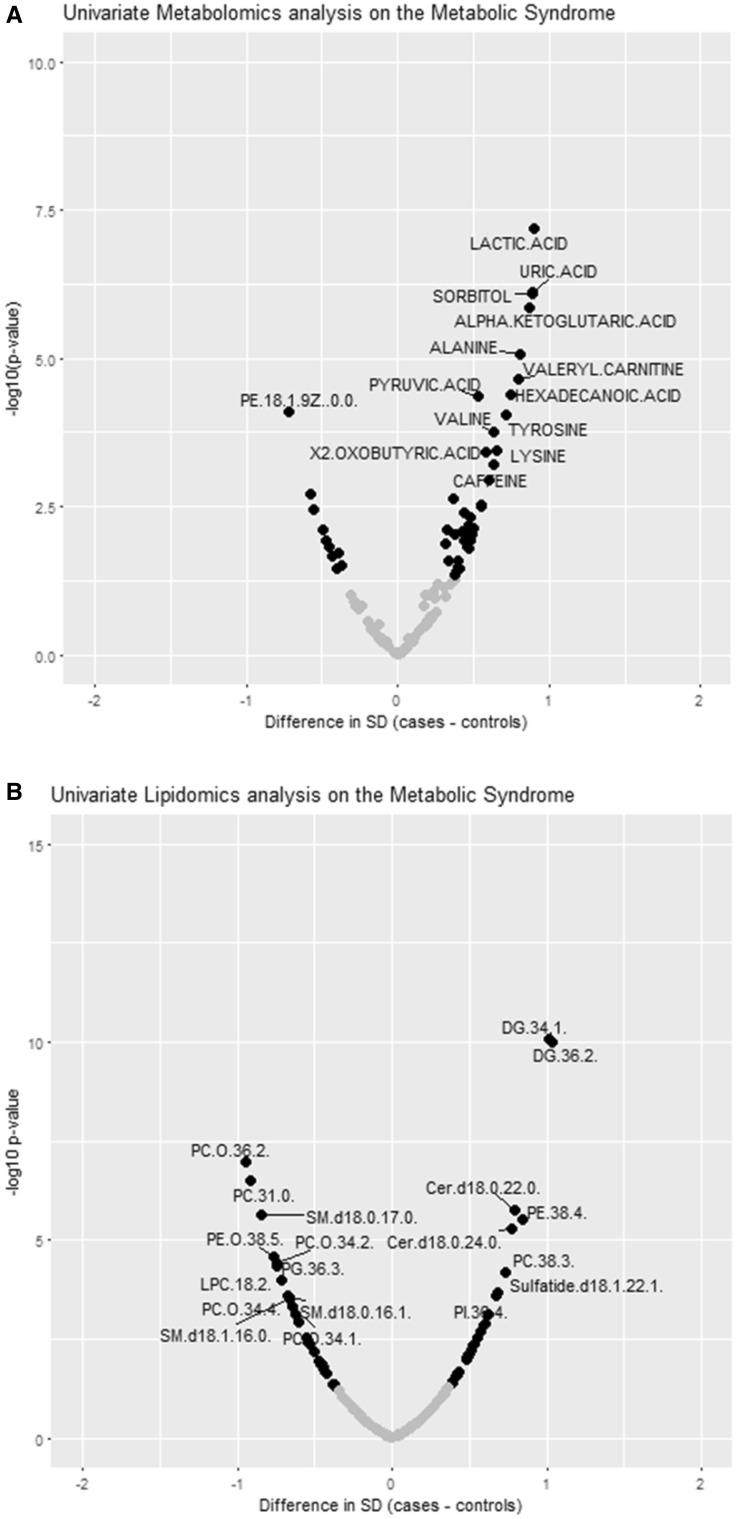
Fig. 3.
Univariate metabolite and lipids analyses. a Univariate metabolite analyses on the metabolic syndrome. b Univariate lipid analyses on the metabolic syndrome. Analyses can be interpreted as the difference in metabolite/lipid level in standard deviation in cases of the metabolic syndrome as compared to controls. The difference between cases of the metabolic syndrome (in standard deviation) is presented on the x-axis; the − log(p-value) of the comparison is presented on the y-axis. Metabolites/lipids that were labelled in the figures were those that remained significant after correction for multiple testing; compounds with a p-value < 0.05 are presented as solid black dots in the plot. In our dataset, there were 67 independent metabolites (p-value cut-off = 7.46 × 10⁻⁴) and 73 independent lipids (p-value cut-off = 6.85 × 10⁻⁴)

