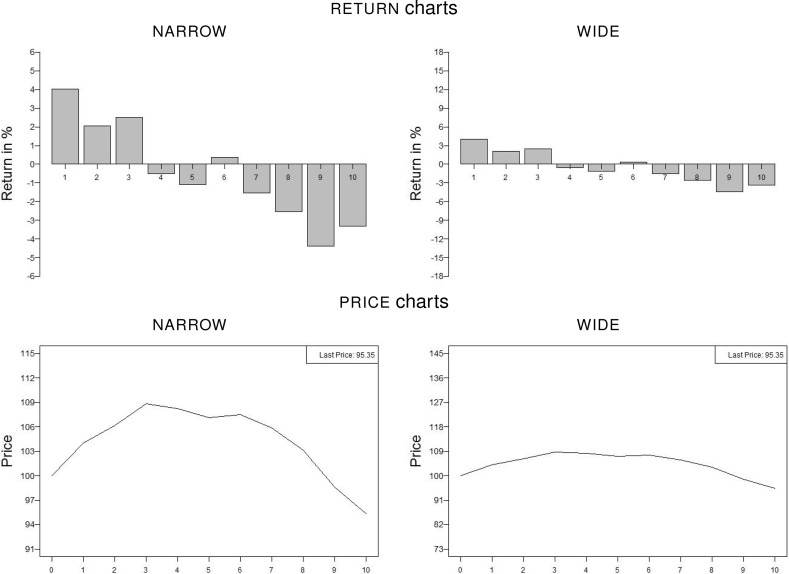
Fig. 3.
Exemplary representations of the -volatility asset with trend in a chart (top) and a chart (bottom) for presentation scales (left) and (right). For return charts the value zero and for price charts the initial price of 100 as well as each tick are at the same positions for both scales. In return bar representations the tick size on a scale is three times the one on a scale; tick sizes in price representations are adjusted accordingly

