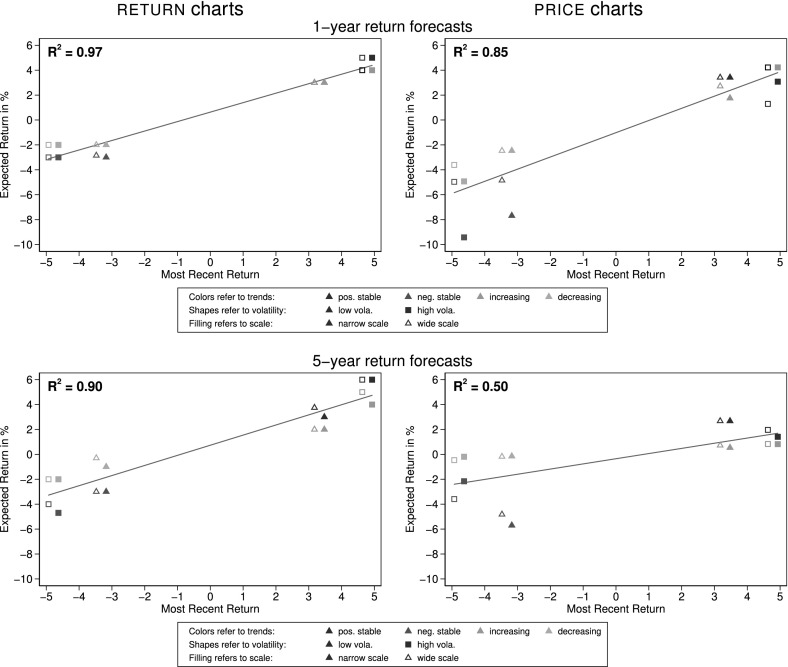
Fig. 5.
Median one-year and five-year return forecasts. This figure shows the median one-year (upper panel) and five-year (lower panel) return forecasts as a function of the most recent return, i.e. the return in Year 10. For better visibility, i.e. to avoid overlapping medians, we add 0.15% to the most recent return of scaling and deduct 0.15% for those of scaling on the horizontal axis. Each point represents the median of between 83 and 109 observations

