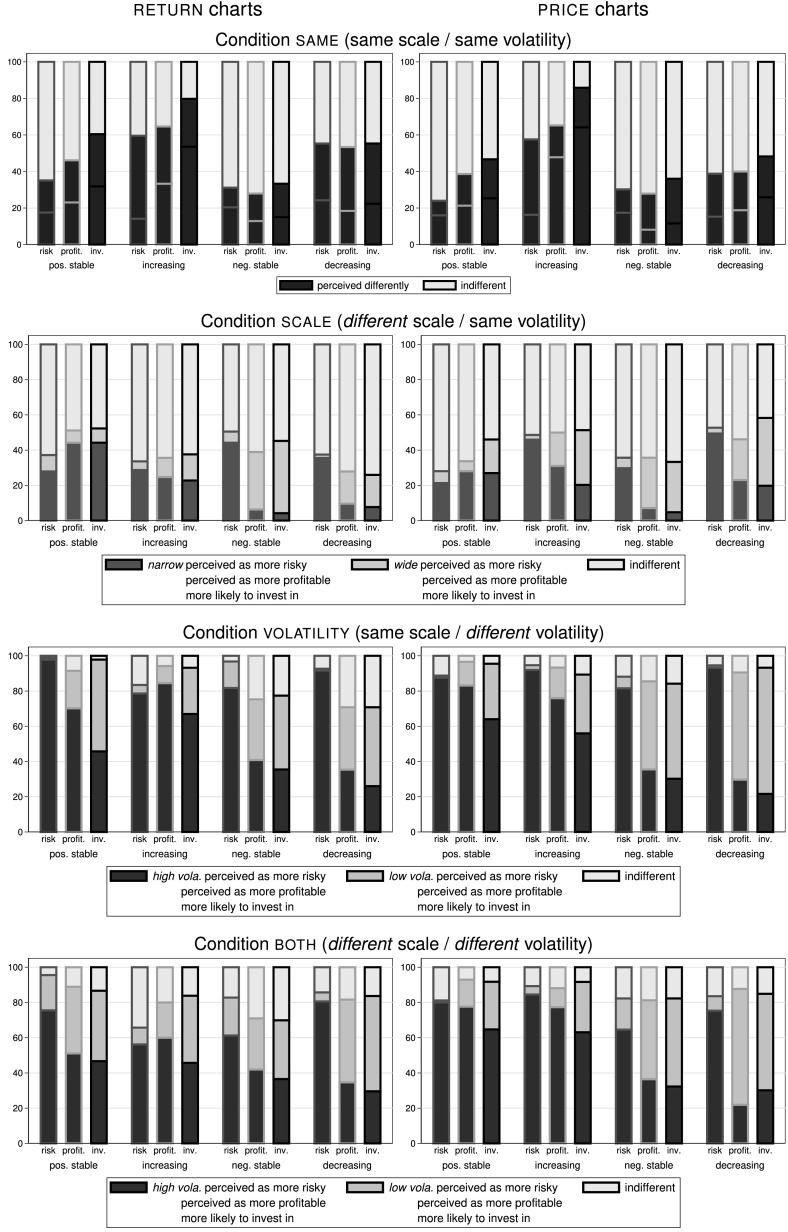
Fig. 7.
Perceived riskiness, perceived profitability, and investment propensity in Task II. This set of panels shows the percentage of decisions in which subjects perceive the riskiness (first bar in each set labelled ‘risk’) and the profitability (second bar; ’profit.’) the same or differently, and in which subjects are more likely to invest in (third bar; ’inv.’), between different scalings and volatilities. The left panels show data for charts, while the right panels show the respective data for charts. From top to bottom we show the four different conditions, where the condition name corresponds to the variable in which the two assets of a pair differ: (same scale / same volatility), (different scale / same volatility), (same scale / different volatility), and (different scale / different volatility). In each panel data for the four distinct price trends are shown separately. Each of the eight panels summarizes between 314 and 386 observations for each variable

