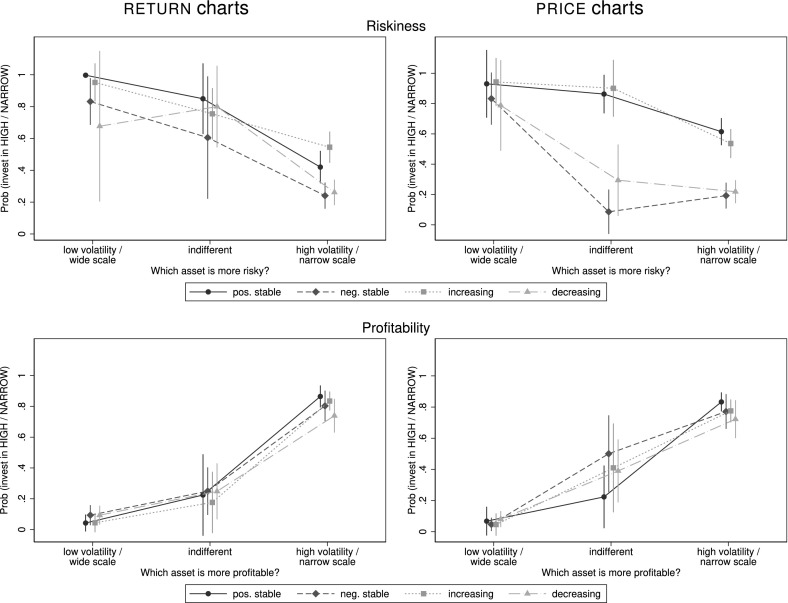
Fig. 8.
Predicted probabilities of investing in the -volatility or -scaled asset. This figure shows the predicted probabilities and 95%-confidence intervals of investing in the -volatility (-scaled) asset depending on which asset is perceived as more risky (top) or as more profitable (bottom). Probabilities are estimated from a probit model with a dummy variable indicating whether the subject would invest in the -volatility (-scaled) asset as the dependent variable and her choice regarding riskiness and profitability as independent variables. The numbers of observations for each estimation lie between 171 and 222 for different presentation formats and trends

