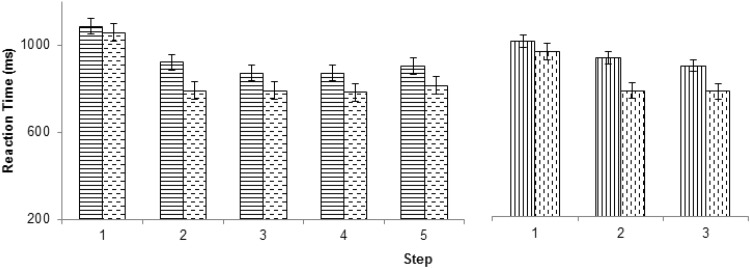
Fig. 2.
Pattern of reaction times across the steps of the 5- and 3-trial episodes (continuous line bars: rule switch trials, dashed line bars: rule repeat trials). Note that trial 1 had the highest RT for both switch and repeat trials in both 5- and 3-trial episodes. Error bars represent 95% confidence intervals calculated using the method suggested by (Loftus & Masson, 1994) for within subject analyses

