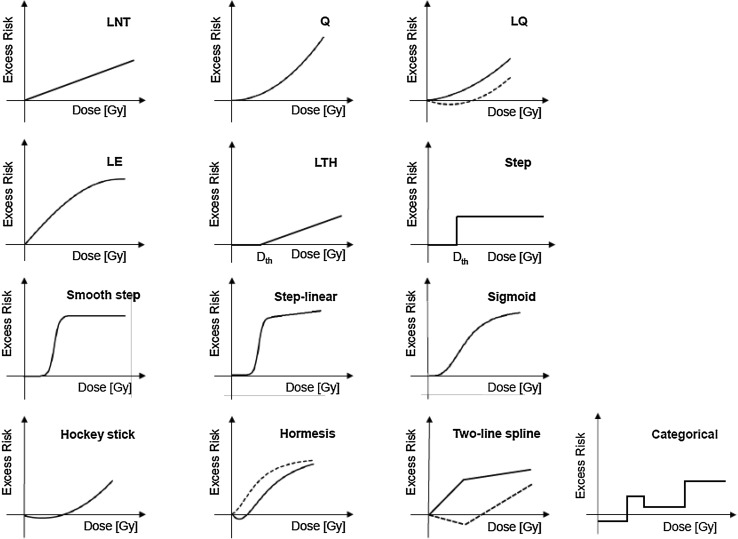
Fig. 1.
Typical shapes of the functions that were used to analyze the dose responses. 1st row: LNT model, quadratic (Q), linear-quadratic (LQ); 2nd row: linear-exponential (LE), linear-threshold (LTH), step-model; 3rd row: smooth step, step-linear, sigmoid; 4th row: hockey stick (J-shaped model), hormesis, two-line spline, categorical model. Additional dashed lines show the flexibility of some of the models. The mathematical equations for all of these models are provided on pages 6–8 of the Online Resource

