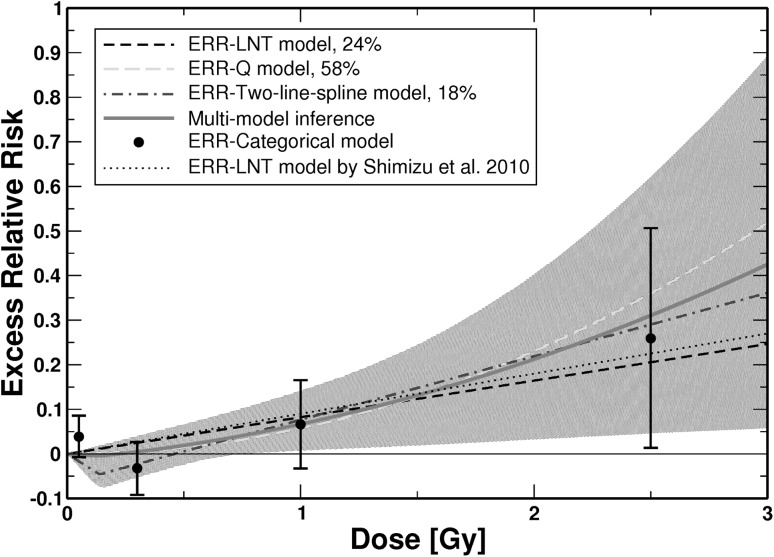
Fig. 2.
ERR for mortality from CeVD versus weighted colon dose (full dose range) for the three final non-nested ERR models and the simulated dose–response curve from MMI. The shaded area represents the 95% CI region for the MMI. For AIC-weights see insert. The dotted line shows the prediction from Shimizu et al. (2010). Point estimates and related 95% CI from the fit of a categorical ERR model that divides the dose range into the following categories (D < 0.005 Gy, 0.005 Gy ≤ D < 0.1 Gy; 0.1 Gy ≤ D < 0.5 Gy, 0.5 Gy ≤ D < 1.5 Gy, and D ≥ 1.5 Gy) are shown. In the categorical fit, zero risk was assigned to the dose range D < 0.005 Gy. The point estimates from the categorical model are provided for comparison. The figure is valid for men and women of both cities. Online version contains color

