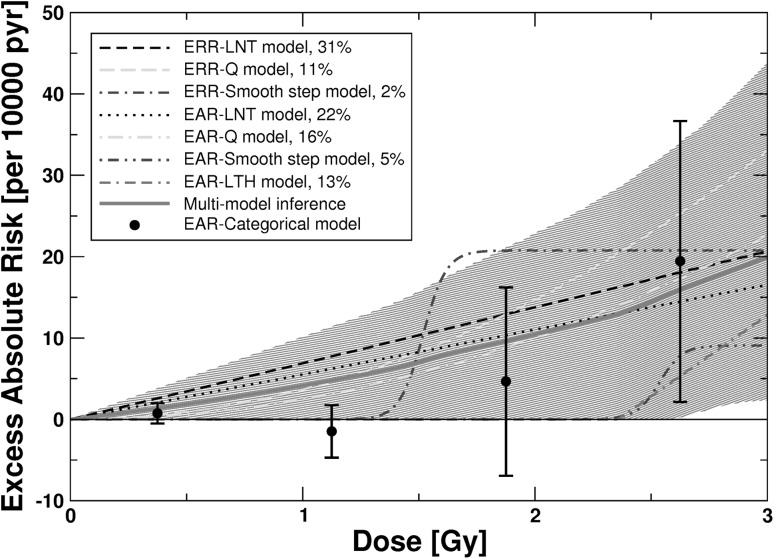
Fig. 5.
EAR for mortality from heart diseases versus weighted colon dose for the seven final non-nested ERR and EAR models and for the simulated dose–response curve from MMI. The shaded areas represent the 95% CI region for the MMI. For AIC-weights see insert. Also provided are point estimates and related 95% CI from the fit of a categorical EAR model that divides the dose range into the following categories (D < 0.005 Gy, 0.005 Gy ≤ D < 0.75 Gy; 0.75 Gy ≤ D < 1.5 Gy, 1.5 Gy ≤ D < 2.25 Gy, and D ≥ 2.25 Gy) with zero risk assigned to the dose range D < 0.005 Gy. This EAR-categorical model contains an age-dependent DEM. The point estimates from the categorical model are provided for comparison. The figure is valid for males from Hiroshima. The preselected values for age at exposure and attained age are 30 and 70 years, respectively. For correction factors for city and females, see Table S8 in the Online Resource. Online version contains color

