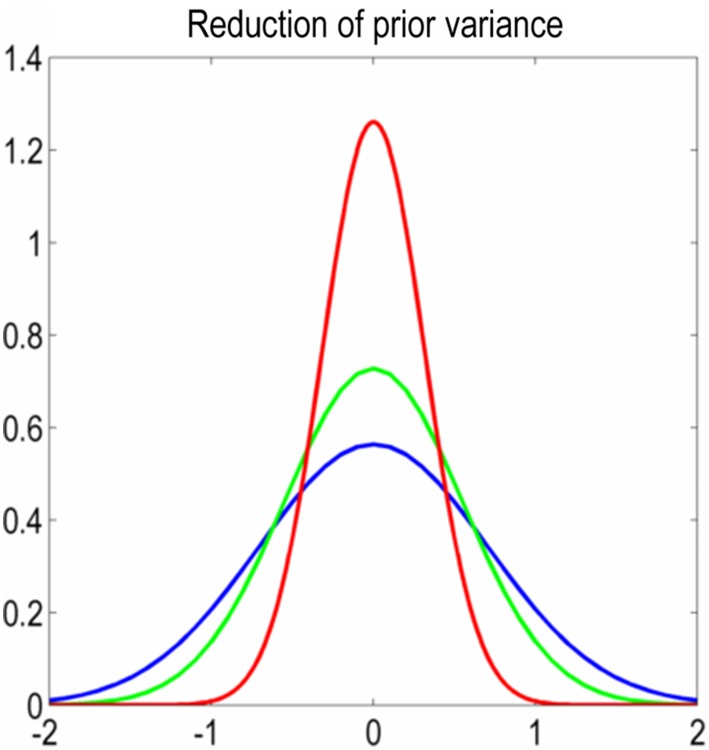
Fig. 1.
Illustration of shrinkage priors in DCM and their reduction. The horizontal axis is the value of the connectivity parameter (i.e., the strength of the connection) and the vertical axis is the prior probability for effective connectivity. The blue line ( = 0.5) is the maximum prior variance used in this study for extrinsic (between-region) DCM connections. Reducing the prior variance, illustrated by the green line ( = 0.3) and the red line ( = 0.1), limits the extent to which a posterior connection parameter can deviate from its prior expectation of zero

