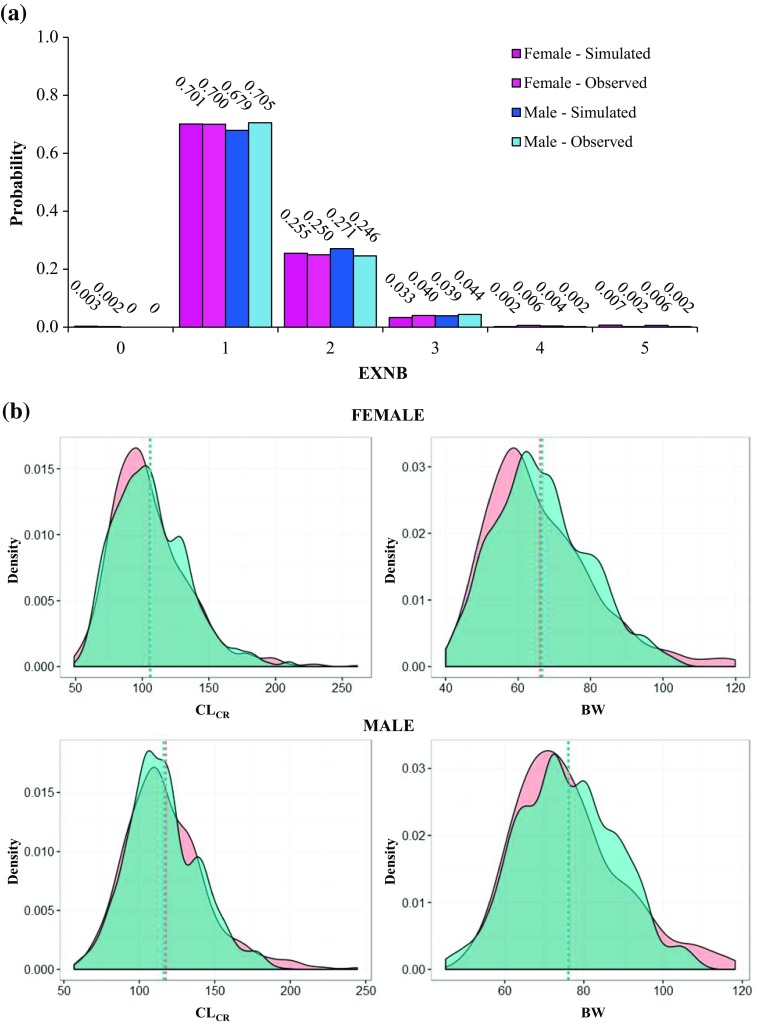
Fig. 1.
Distribution of sampled covariates. a Probability distribution of experiencing a different total number of relapses in the 12 months preceding study entry in simulated and observed patients. b Probability density functions of both resampled and observed creatinine clearance and body weight for female (top) and male (bottom) subjects. The density of each resampled covariate (green area) well reproduces the correspondent observed density (orange area), as shown by area overlapping and very similar mean values (dashed lines). BW body weight, CLCR creatinine clearance, EXNB number of relapses in the 12 months preceding study entry

