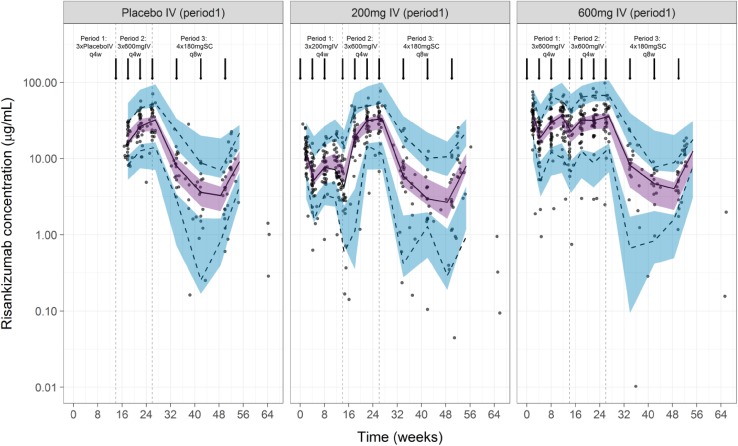
Fig. 3.
Visual predictive check for the phase II Crohn’s disease study using the final model. Solid lines represent the medians of the observed data; dashed lines represent the 5th and 95th percentiles of the observed data, together encompassing the 90% prediction interval; the shaded regions represent the 95% confidence intervals of the corresponding simulated percentiles (purple for the median and blue for the 5th and 95th percentiles); the arrows indicate the timings of the doses. IV intravenous, SC subcutaneous, q4w every 4 weeks, q8w every 8 weeks

