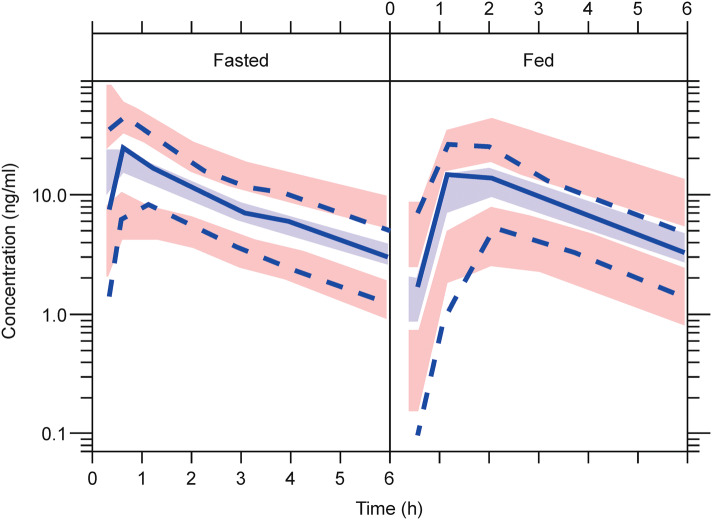
Fig. 2.
Population pharmacokinetic visual predictive checks for plasma cladribine concentrations in fasted and fed conditions. Light blue shaded area indicates simulated median with uncertainty; pink shaded area indicates simulated 5th and 95th percentiles with uncertainty; solid blue line indicates observed median; dashed blue line indicates observed 5th and 95th percentiles.
Adapted from Savic et al. [19]. © The Authors 2017

