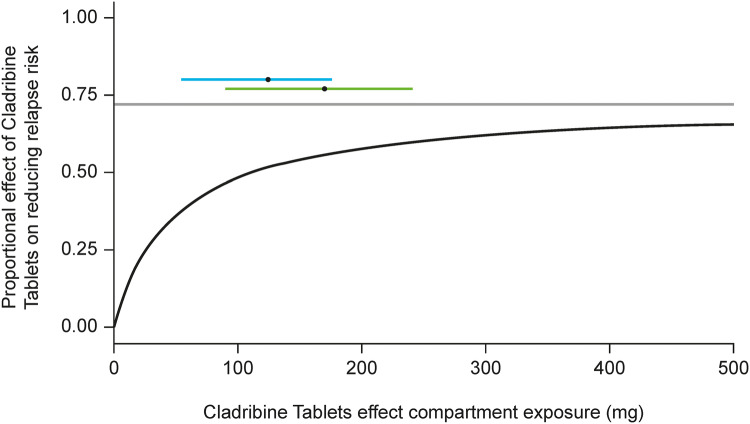
Fig. 5.
Model-derived exposure–effect relationship, together with the range of cladribine effect compartment exposure at the end of year 2 of the CLARITY study. The black line represents the model-derived relationship between cladribine exposure in the effect compartment (x-axis) and the effect (y-axis), which is the drug-dependent factor multiplying the underlying hazard of having a relapse that exists in the absence of treatment. The grey line represents the Emax, estimated at 72%. The 5th–95th range of effect compartment exposure at the end of year 2 (based on subjects in the CLARITY trial) following the 3.5 mg/kg (blue line) and 5.25 mg/kg (green line) regimens is also shown, with the black dots representing the respective median exposure. Emax maximum obtainable effect

