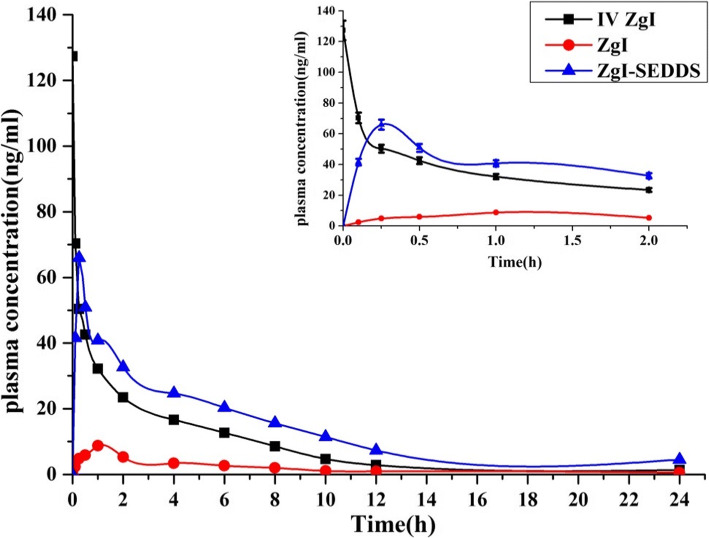
Fig. 9.
Mean plasma concentration-time curves of ZgI after i.v of a single dose of 2 mg/kg of ZgI Tween-20 solution, oral administration of a single dose of 20 mg/kg of ZgI Tween-20 solution, and equivalent dose of oral ZgI-SMEDDS. Picture on the top right corner was the plasma concentration-time curves for 0-2 h duration (mean ± SEM, n = 6/group)

