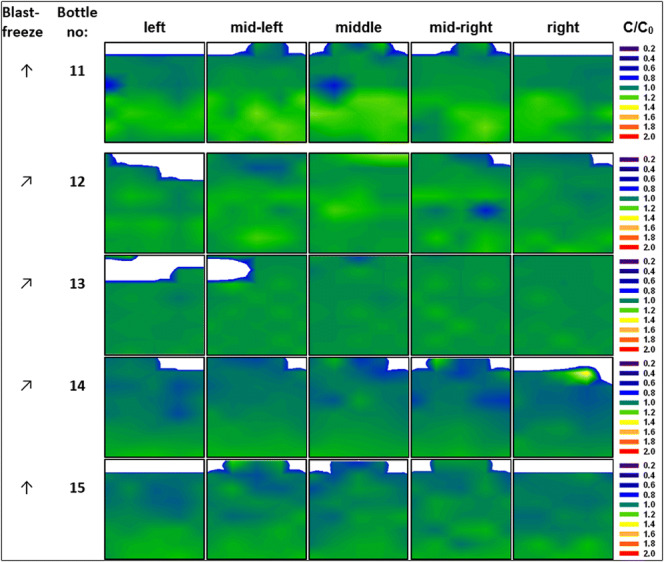
Fig. 5.

Contour maps for relative concentration [C/C0] of mAb in the 2-L PET-G bottle after freezing in the blast freezer to − 80°C. Arrows indicate positioning of the bottle in either an upright position (↑) or at a 60° angle (↗). White areas represent headspace above the surface
