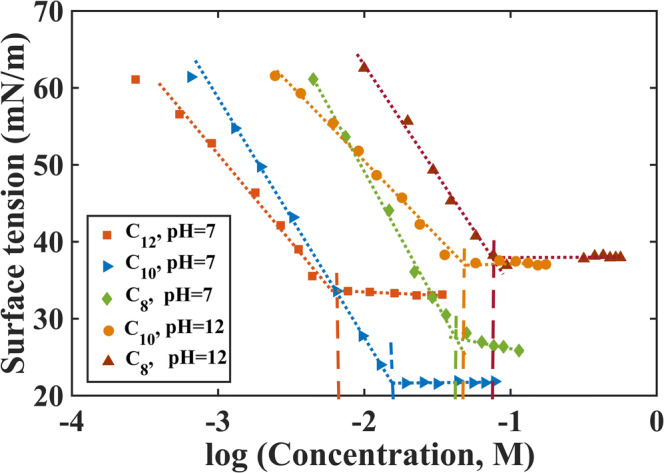
Fig. 3.

Surface tension (mN/m) vs log MCFA concentration (M) for C8, C10, and C12. The dotted line shows the fitting of the linear parts of the data set using linear regression by least squares. The corresponding concentration of the intersection of the two lines for each MCFA as indicated by the dashed lines was considered to be the CMC
