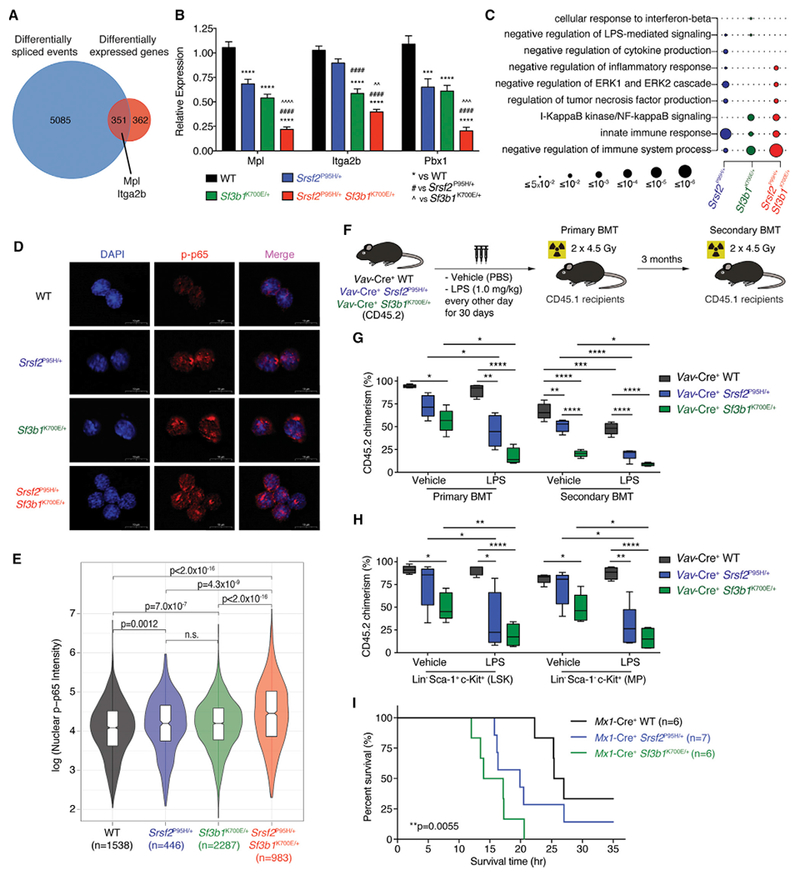
Figure 5. Co-expression of Srsf2 and Sf3b1 Mutations Results in Aberrant Splicing and Expression of Key Regulators of Hematopoietic Stem Cell Survival and Quiescence.

(A) Venn diagram of genes differentially expressed and spliced in Mx1-Cre+ Srsf2P95H/+ Sf3b1K700E+ cells relative to Mx1-Cre+ WT cells in any replicate.
(B) Expression of Mpl, Itga2b, and Pbx1 in lineage- c-Kit+ (LK) cells from Mx1-Cre+ Srsf2P95H/+ Sf3b1K700E/+ mice relative to control groups (n = 8–10 mice per genotype). Error bars represent mean ± SD. ***p < 0.001, ****p < 0.0001 versus Mx1-Cre+ WT; ####p < 0.0001 versus Mx1-Cre+ Srsf2P95H/+; AAp < 0.01, AAAp < 0.001, AAAAp < 0.0001 versus Mx1-Cre+ Sf3b1K700E/+.
(C) GO enrichment analysis of Mx1-Cre+ Srsf2P95H/+, Mx1-Cre+ Sf3b1K700E/+, and Mx1-Cre+ Srsf2P95H/+ Sf3b1K700E/+ cells relative to Mx1-Cre+ WT cells. Circle size indicates the magnitude of the p value for each term and comparison.
(D) Immunofluorescence of nuclear phosphorylated-p65 (p-p65) level in LK cells from Vav-Cre+ WT, Vav-Cre+ Srsf2P95H/+, Vav-Cre+ Sf3b1K700E/+, and Vav-Cre+ Srsf2P95H/+ Sf3b1K700E/+ mice following LPS stimulation ex vivo. Scale bars, 10 mm.
(E) Violin plots quantifying nuclear p-p65 intensity of LK cells from (D). ANOVA and Kruskal-Wallis ranked test was performed and adjusted for false discovery rate.
(F) Schema of competitive BMT using BM MNCs from Vav-Cre+ WT, Vav-Cre+ Srsf2P95H/+, and Vav-Cre+ Sf3b1K700E/+ mice after chronic LPS exposure.
(G) Percentage of CD45.2 chimerism in peripheral blood of recipients (n = 4–5 mice per group) from primary and secondary BMT (both at 10 weeks post BMT).
(H) Chimerism of LSK or myeloid progenitor (MP; lineage- Sca-1- c-Kit+) fractions from primary recipients 14 weeks post BMT.
(I) Kaplan-Meier analysis of Mx1-Cre+ WT, Mx1-Cre+ Srsf2P95H/+, and Mx1-Cre+ Sf3b1K700E/+ mice after a single dose of LPS (15 mg/kg) in vivo. Log-rank Mantel-Cox test was performed. p = 0.0055.
ANOVAand Tukey’s post hoc test were used to compare groups. *p < 0.05, **p < 0.01, ***p < 0.001, ****p < 0.0001 versus Uav-Cre+WT mice(“#” denotes versus Vav-Cre+ Srsf2P95H/+ mice and “Λ” denotes versus Vav-Cre+ Sf3b1K700E/+ mice). In (G) and (H), the top and bottom lines of the box represent the upper and lower quartiles, respectively; the line inside the box represents the median; the lines above and below the box represent the maximum and minimum values, respectively. See also Figure S5 and Table S6.
