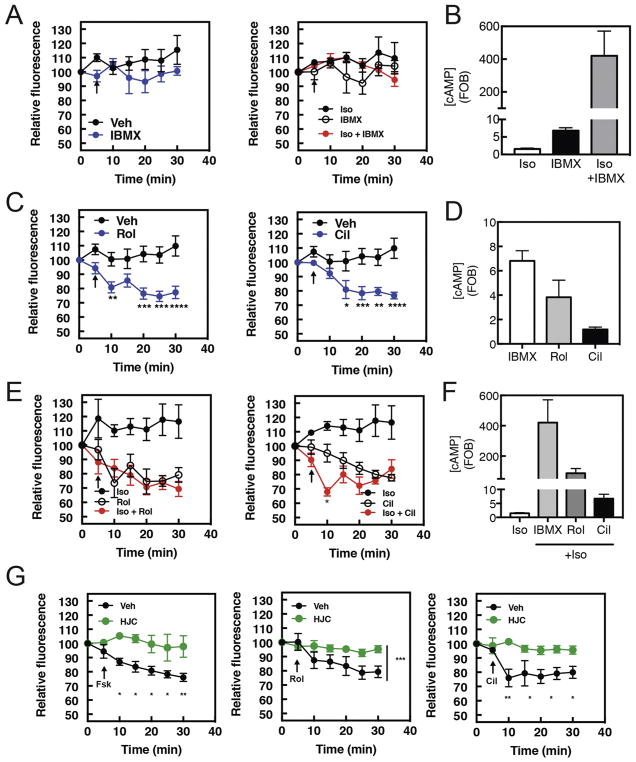
Figure 2. Rolipram and Cilostamide stimulate PI4P hydrolysis in NRVMs, with Isoproterenol stimulation increasing the rate of Cilostamide-induced PI4P hydrolysis.
NRVMs were transduced with GFP-FAPP-PH adenovirus overnight before imaging in 1% FBS containing media. A) Time course of IBMX (300μM) or Iso (1 μM) plus IBMX induced PI4P hydrolysis. Arrow indicates time of stimulant addition. B) cAMP accumulation by PDE inhibitors. NRVMs were grown for 48hrs before being serum starved overnight and stimulated with either Iso (10 μM), IBMX (300 μM) or Iso (1 μM) plus IBMX for 15 min. Cells were then lysed and ELISA for cAMP performed according to manufacturer’s instructions. Data are representative of experiments performed three times. C) Time course PDE4 inhibitor Rolipram (10μM) or PDE3 inhibitor Cilostamide (10μM) induced PI4P hydrolysis. Phosphodiesterase inhibitors were added as indicated by arrow. D) NRVMs were grown for 48hrs before being serum starved overnight and stimulated with either Cilostamide (10μM), Rolipram (10μM) or IBMX (300μM) for 15 min and assayed for cAMP accumulation as in B. E) Time course Rolipram (10μM) or Cilostamide (10μM) induced PI4P hydrolysis in the presence of Isoproterenol (1μM). Isoproterenol and phosphodiesterase inhibitors were added simultaneously as indicated by arrow. F) NRVMs were grown for 48hrs before being serum starved overnight and stimulated with either Cilostamide (10μM), Rolipram (10μM) or IBMX (300μM) for 15 min in combination with Isoproterenol (1μM) and assayed for cAMP accumulation as in B. G) Epac inhibition blocks PDE effects. The Epac inhibitor HJC0726 (1μM) was added for 15 min before imaging. Forskolin (10 μM), Rolipram (10μM) or Cilostamide (10μM) were added at the arrows and PI4P hydrolysis was measured. For all experiments Data taken from at least 3 cells from 3 separate preparations of NRVMs. All graphs are presented as mean ± standard error. All data was analyzed by two way unpaired ANOVA with Sidak’s post-hoc test. *p<0.05 ** p<0.001 *** p<0.0001 **** p<0.00001

