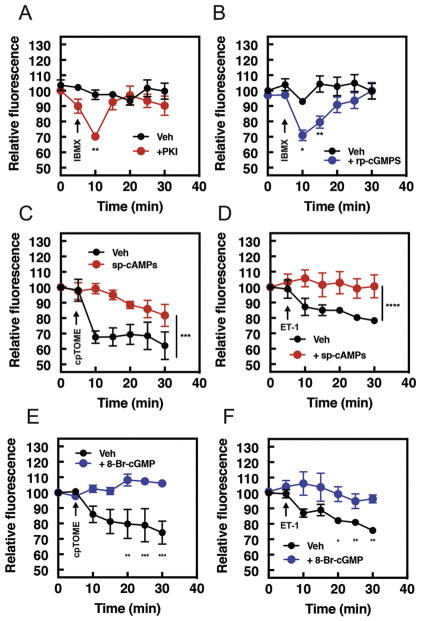
Figure 4. PKA or PKG activation inhibits PI4P hydrolysis by cAMP and Gβγ-dependent pathways.
NRVMs were transduced with GFP-FAPP-PH adenovirus overnight before imaging. A) Time course of IBMX (300μM added at the arrow) induced PI4P hydrolysis in the presence of the PKA inhibitor myrPKI (1 μM) or B) PKG inhibitor, rp-cGMPS (10μM). C) Time course of cpTOME (10 μM) or D) ET-1 mediated PI4P hydrolysis in the presence of either vehicle DMSO or the PKA activator sp-cAMPs. E) Time course of cpTOME (10 μM) or F) ET-1 mediated PI4P hydrolysis in the presence of either vehicle DMSO or cGMP analogue, 8-Br-cGMP. PKI, rp-cGMPs, sp-cAMPs, or 8-Br-cGMP were added 15 mins before imaging. Data are from 4 cells from 4 separate preparations of NRVMs. All time course graphs are presented as mean ± standard error. All data was analyzed by two way unpaired ANOVA with Sidak’s post-hoc test. *p<0.05 ** p<0.001 *** p<0.0001 **** p<0.00001. Data is significantly different across complete time course or at each individual time point, as indicated.

