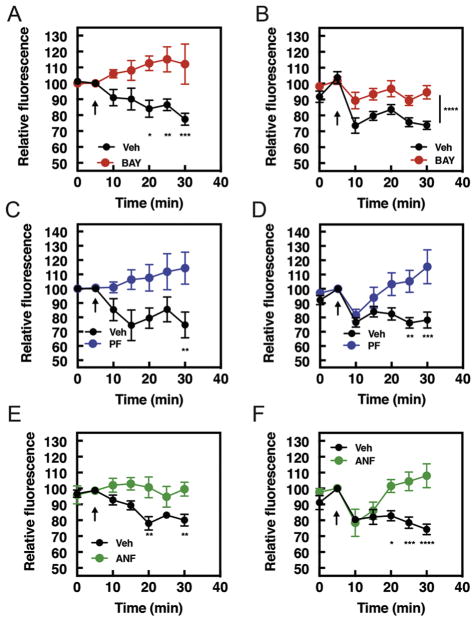
Figure 5. BAY60-7550, PF04449613 and atrial natriuretic peptide (ANF) inhibit the ability of ET-1 and Forskolin to stimulate PI4P hydrolysis.
A) Time course of BAY60-7550 (10 μM) or vehicle treated NRVMs after stimulation with either ET-1 (100 nM,) or B) Forskolin (10 μM) and measurement of PI4P hydrolysis. Images captured from at least n=4 cells from at least 4 separate preparations of NRVMs. C) Time course of PF-04449613 (10μM) or vehicle treated NRVMs after stimulation with either ET-1 (100nM, left) or D) Forskolin (10 μM, right) and measurement of PI4P hydrolysis. Images captured from at least n=3 cells from at least 3 separate preparations of NRVMs. E) Time course of either ET-1 (100 nM, left) or F) Forskolin (10 μM, right)–stimulated PI4P hydrolysis after incubation either ANF (10 nM) or vehicle control. Images and time courses are from at least 5 cells from 5 separate preparations of cells. NRVMs were transduced with GFP-FAPP-PH adenovirus overnight before imaging. BAY60-7550, PF04449613 and ANF were added 15 mins before samples were transferred to microscopy stage for imaging. All time course graphs are presented as mean ± standard error. All data was analyzed by two way unpaired ANOVA with Sidak’s post-hoc test. *p<0.05 ** p<0.001 *** p<0.0001 **** p<0.00001.

