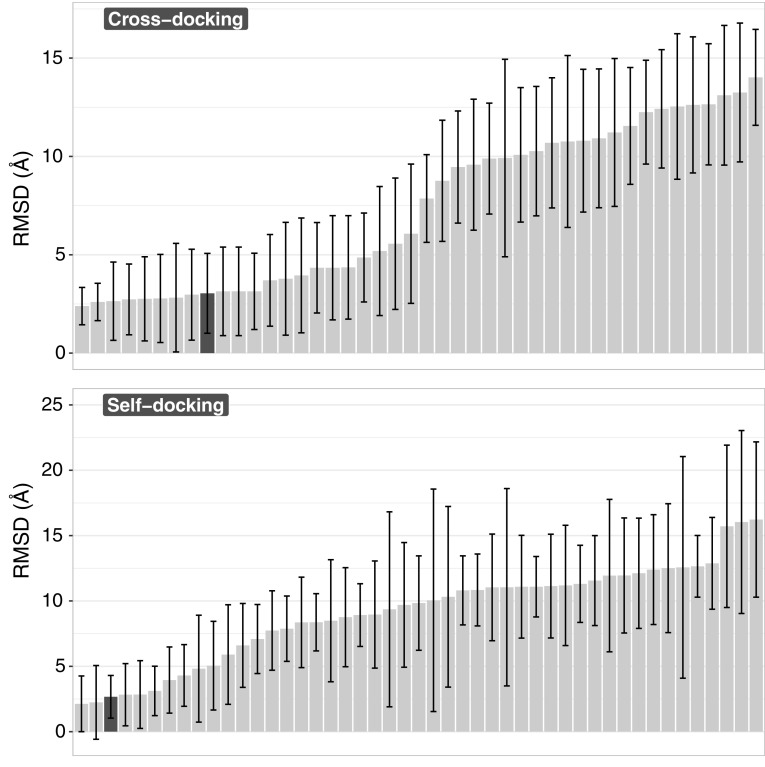
Fig. 4.
Heavy-atom RMSD values averaged over all models and all targets. Top: cross-docking experiment. Bottom: self-docking experiment. Every bar corresponds to a single submission. The error bars indicate the standard deviation of the mean RMSD. HADDOCK submission is represented by the dark-grey bar in both panels

