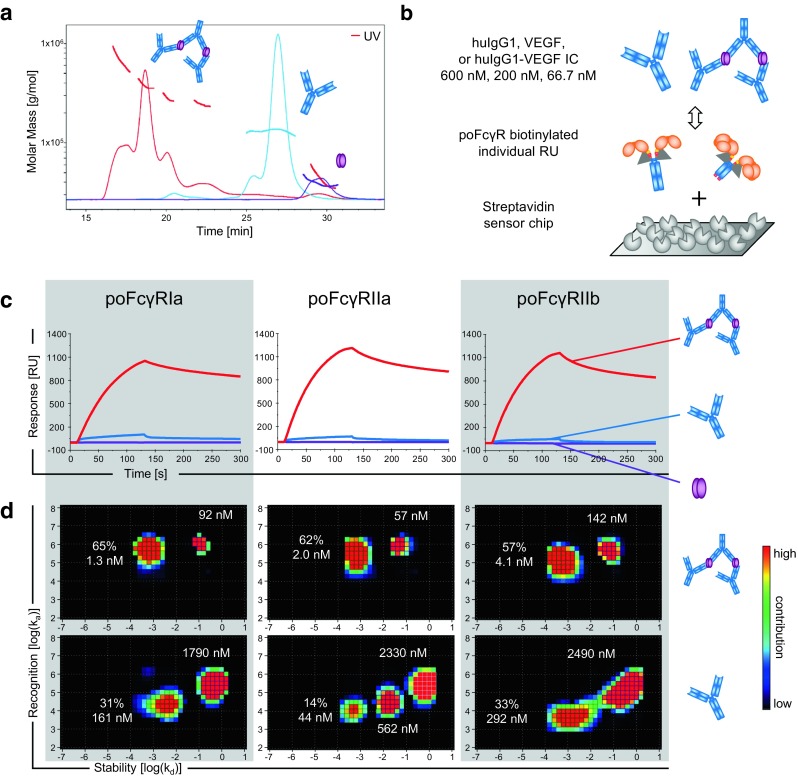
Fig. 3.

Comparison of free bevacizumab and IC by binding to poFcγRs using SPR. (a) SEC-MALS analysis shows the molecular weight of free bevacizumab (blue line), VEGF (purple line), and complexes formed by bevacizumab and VEGF in a molar ratio of 1:5 (red line). (b) Biotinylated (grey triangles) soluble poFcγRs were captured with different densities on a streptavidin senor chip. Interactions with free bevacizumab (blue) and IC with VEGF dimers (purple ovals) were measured by SPR. Three different concentrations of IC and free huIgG1 with the same amount of IgG were assayed (600, 200, 66.7 nM). PoFcγRIIIa was excluded from this experiment due to insufficient biotinylation. (c) SPR sensorgrams resulting from binding of the above indicated FcγR to the highest concentration of VEGF (purple line), bevacizumab (blue line), and IC (red line) are shown. (d) Binding curves from panel C were resolved by the Interaction Map method. Binding of huIgG1 IC to the FcγR indicated above each column is shown in the upper row and binding of free huIgG1 is shown below. The equilibrium binding constant KD [nM] is indicated next to each major interaction spot and its contribution [%] to the total binding is indicated for the spot with the highest affinity.
