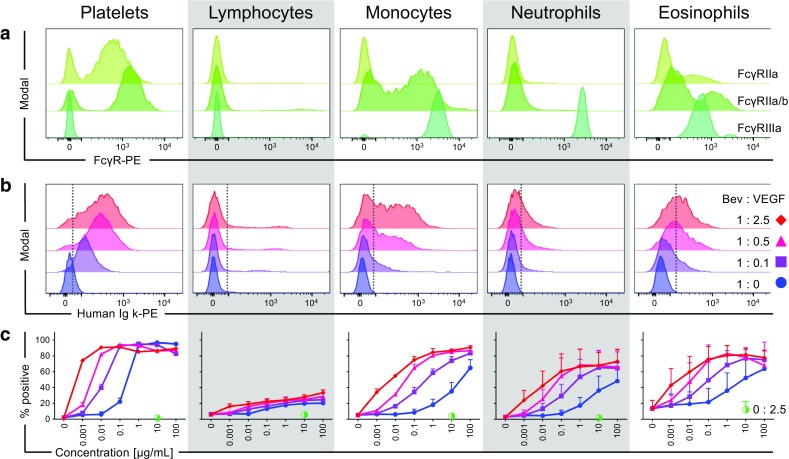
Fig. 4.

Binding of free huIgG1 (bevacizumab) and IC to minipig whole blood in comparison to the FcγR expression. FcγR expression and huIgG binding was assessed by flow cytometry in whole blood of Göttingen minipigs. The cell types were gated from single live cells by their FSC and SSC properties as described in detail in Fig. S4. (a) Histograms show the expression of poFcγRIIa (HuCAL32, light green histogram), poFcγRIIa/b (cross reactive HuCAL91, green histogram) and poFcγRIIIa (clone G7, dark green histogram) in platelets, lymphocytes, monocytes, neutrophils and eosinophils (from left to right). (b) Stacked histograms show the binding of 0.1 μg/ml free huIgG1 (blue) and the same amount of huIgG1 complexed using 0.1 parts of VEGF165 (purple), 0.5 parts of VEGF165 (magenta), or 2.5 parts of VEGF165 to the different minipig blood cell subsets. The dotted line represents the gate separating PE-negative (left) from PE-positive (right) events. (c) Graphs show the percentage of PE-positive cells with increasing concentrations of free- (blue circles) and immune-complexed bevacizumab with concentrations ranging from 100 to 0.001 μg/ml of huIgG1 and a control containing 0 μg/ml bevacizumab or IC. IC generated by the following antibody to target ratios are displayed: 1:0.1 (purple squares), 1:0.5 (magenta triangles), 1:2.5 (red diamonds), and VEGF alone (half-filled green circle). Error bars represent the standard deviation within one representative experiment using three minipigs. Multiple experiments with IC (ratio 1:2.5) using a total of seven minipigs led to similar results.
