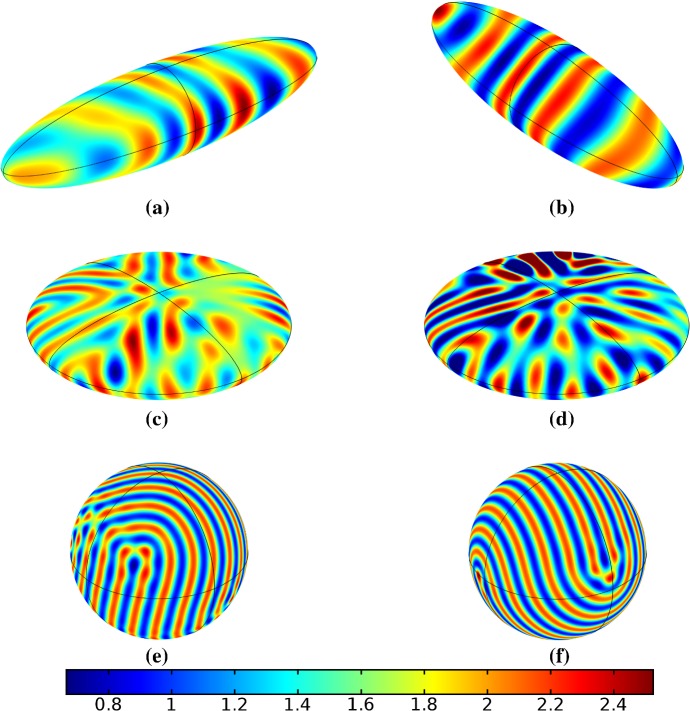
Fig. 18.
Simulations of Eq. (41) with kinetics given by (44) using parameters S2. We plot the distribution of u. In a, c, e, we show staged growth along axes x, y, and then z, whereas in b, d, and f we show staged growth along axes y, x, and finally z. These are at times a, b, c, d, and e, f (Color figure online)

