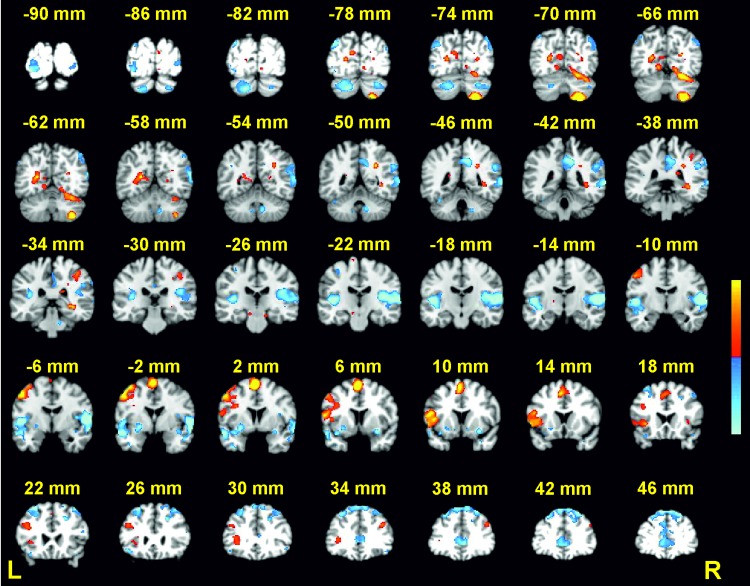
Fig. 3.
Activations for high vs. low cognitive load (peak coordinates provided in Table 1). Coronal slices from Talairach y = + 46 to − 90 mm are depicted. Positive activations (high > low) are shown in red; negative activations (low > high) are shown in blue; p < .001 − .00001

