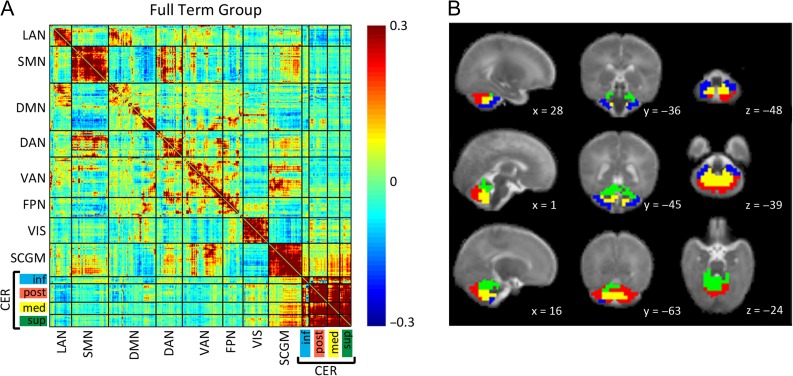
Figure 2.
(A) Full-term infant group mean Fisher’s z-transformed correlation coefficient matrix depicting relationships between ROI pairs covering the entire brain. Warm colors indicate positive correlation coefficients, while cool colors represent negative correlation coefficients. The matrix is sorted into 7 cortical, 1 subcortical, and 4 cerebellar RSNs with hierarchical clustering applied for within network sorting of ROIs. Block structure along the diagonal corresponds to networks and black lines denote borders between networks. LAN = language network; SMN = somatomotor network; DMN = default mode network; DAN = dorsal attention network; VAN = ventral attention network; FPN = frontoparietal network; VIS = visual network; SCGM = subcortical gray matter; CER inf = inferior cerebellum; CER post = posterior lateral cerebellum; CER med = medial cerebellum; CER sup = superior cerebellum/vermis. (B) Localization of cerebellar networks identified by hierarchical clustering of cerebellar ROIs in the full-term infant group overlaid on an infant atlas brain in sagittal, coronal, and axial views. Planes are identified by atlas x, y, and z coordinates. Blue = inferior cerebellum; Red = posterior lateral cerebellum; Yellow = medial cerebellum; Green = superior cerebellum/vermis.

