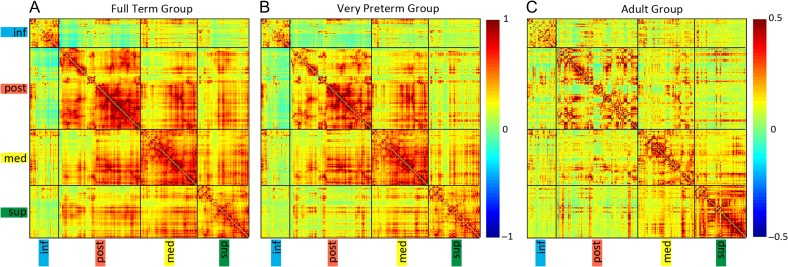
Figure 3.
Group mean Fisher’s z-transformed correlation coefficient matrices representing all ROI pairs within the cerebellum sorted using results from the hierarchical clustering of full-term infant group. Black lines indicate borders between networks. (A) Full-term infants, (B) Very preterm infants, and (C) Adults. inf = inferior cerebellum; post = posterior lateral cerebellum; med = medial cerebellum; sup = superior cerebellum/vermis.

