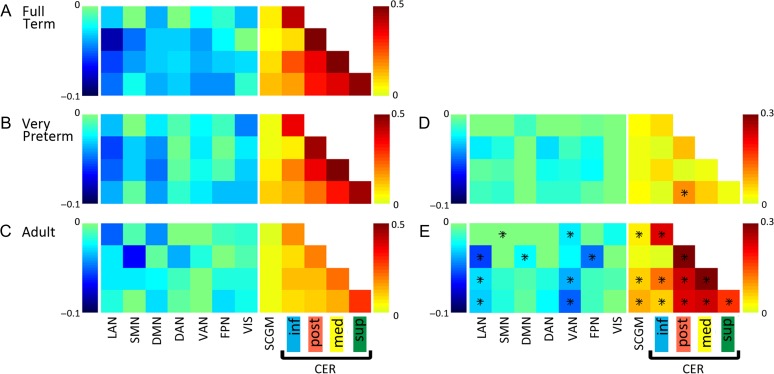
Figure 4.
Group mean Fisher’s z-transformed correlation coefficient matrices demonstrating composite cortico-, subcortico-, and cerebello-cerebellar connectivity patterns for all ROI pairs grouped by RSN for (A) full-term infants, (B) very preterm infants, and (C) adults. Difference matrices are displayed in (D) for full-term minus very preterm groups and (E) full-term minus adult groups. Significant group differences after multiple comparisons correction are indicated by black stars. Only those rows which included cerebellar ROIs were selected from larger correlation coefficient matrices for display. Warm colors indicate positive correlation coefficients, while cool colors represent negative correlation coefficients.

