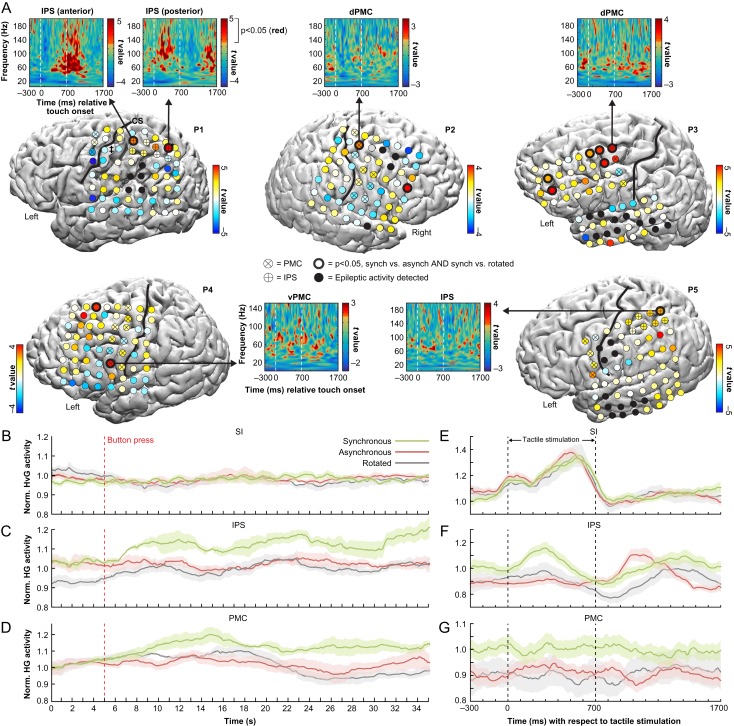
Figure 2.
(A) ECoG responses during the rubber hand illusion. To identify illusion-specific neuronal population activity, we searched for electrodes that had significantly (P < 0.05, FDR-corrected) increased mean high-γ power in the synchronous illusion condition compared with the asynchronous and rotated control conditions. Consistent with our prediction, such electrodes (indicated with bold black circles) were found in all participants and were mainly located in our ROIs in the ventral (v) and dorsal (d) premotor cortex (PMC) and along the intraparietal sulcus (IPS). As seen in the time–frequency t-maps showing the t-values for the SynchPOST versus AsynchPOST contrast, this illusion activity was best measured in the high-γ frequency range (70–200 Hz). The electrodes are color coded by their t values in the SynchPOST versus AsynchPOST contrast. (B–D) High-γ activity over time. The temporal profiles of relative high-γ activity changes for the entire block of stimulation, averaged over trials, are shown for 3 representative electrodes in the SI (see electrode with ‡ in P1, panel A), IPS (* in P1, panel A) and PMC (* in P3, panel A) for each of the experimental conditions. As hypothesized, there was a marked high-γ activity increase in the multisensory PMC and IPS—but not in the unisensory SI—in the synchronous condition in association with the button press by which the participants indicated the onset of the illusion. (E–G) The temporal profiles of relative high-γ activity with respect to the tactile stimulation delivered to the real hand, averaged over all individual touches, for the same representative SI, IPS and PMC electrodes. As expected, in SI, the high-γ activity was directly related to the tactile stimulation and the mean high-γ power across the duration of the epoch did not significantly differ across conditions (F = 0.70, P = 0.50, one-way ANOVA; panel E). Interestingly, the pattern of illusion-related high-γ activity in the IPS (panel F) appeared more time-locked to the tactile stimulation than the activity in the PMC (panel G). This observation was confirmed in a post hoc analysis across all significant IPS and PMC electrodes (Fig. 3), which suggests distinct functional roles of the PMC and IPS in the limb self-attribution process (see Discussion for details). The shaded areas represent the SEM.

