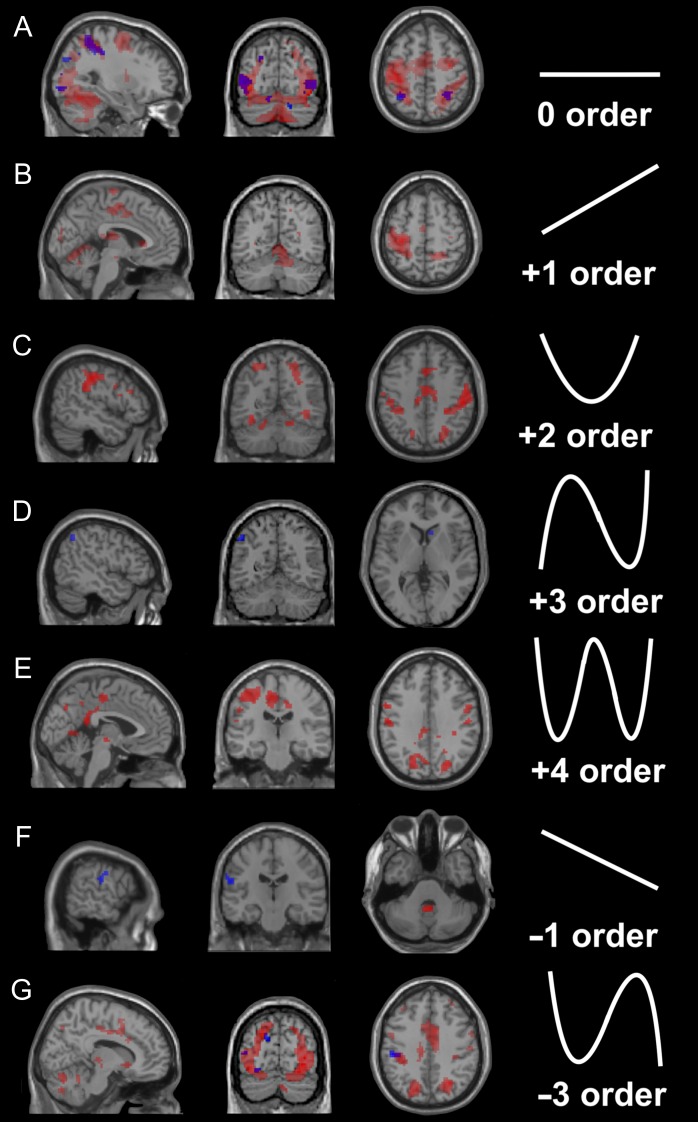
Figure 4.
Whole-brain BOLD effects in action execution and observation. Brain maps at the group level corresponding to different orders of the BOLD-GF association in the action execution (AE, in red) and action observation (AO, in blue) conditions. The images show areas of activation at different orders. Note that both force-related and unrelated BOLD effects are found in the cerebral cortex and cerebellum. A threshold Pu< 0.001 (k ≥ 10; Pu = P uncorrected for multiple comparisons) was used for display purposes. The shape of the orthogonalised polynomial function that was fitted to the signals is shown for the (A) 0, (B) +1st, (C) +2nd, (D) +3rd, (E) +4th, (F) −1st, and (G) -3rd orders, to the right of the corresponding image showing significant clusters. In this and all the following figures, right is right and left is left.

