Figure 7.
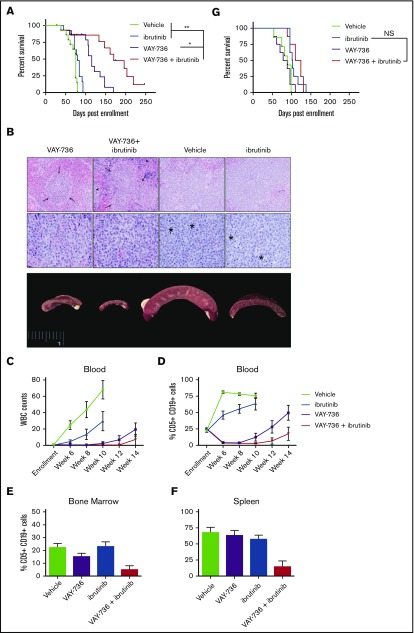
VAY-736 combines effectively with ibrutinib in vivo. Tumor-derived splenocytes from disease-burdened Eμ-TCL1 mice were engrafted into SCID mice. (A) Kaplan-Meier survival plot receiving weekly VAY-736 (10 mg/kg) retro-orbital injections, vehicle control injections, ibrutinib drinking water, or combination VAY-736 + ibrutinib, for up to 6 injections of VAY-736 or vehicle, and continuous ibrutinib drinking water provided through study. Leukemic death was confirmed upon death by fluorescence-activated cell sorting analysis of blood, spleen, and bone marrow CD5+ CD19+ percentage of lymphocytes (VAY-736 + ibrutinib vs ibrutinib, P < .0001; VAY-736 + ibrutinib vs VAY-736, P = .06; n = 14 per group). Adjustments for multiple comparisons for the log-rank test were used for data analysis. *P < .05 and **P < .01. (B) After 6 weeks, 2 animals per group were euthanized and samples sent for histopathology analysis. Splenic white pulp expanded by leukemia cells is visible as white foci in the enlarged spleens. Splenic white pulp areas (arrows) and red pulp (arrow heads) are infiltrated and expanded by leukemia cells in all specimens. Top row: photomicrographs at low-power magnification to show level of infiltration (magnification ×20; hematoxylin and eosin stain). Middle row: high-power magnification to show cellular detail (magnification ×60; hematoxylin and eosin stain). Mitotic figures are indicated with an asterisk. Bottom row: gross anatomy images of spleens. White blood cell (WBC) counts from blood smears (C) and CD5+ CD19+ percent circulating lymphocytes (D) were observed weekly for leukemia progression. (E-F) At death, spleen and bone marrow were analyzed by fluorescence-activated cell sorting for percent lymphocytes CD5+ CD19+. (G) Kaplan-Meier survival plot of a repeated experiment described in panel A except with engraftment into NOTAM mice lacking functional FcRγ (VAY-736 + ibrutinib vs ibrutinib, P = .4921; VAY-736 vs vehicle, P = .7453; n = 7 to 8 per group). NS, not significant.

