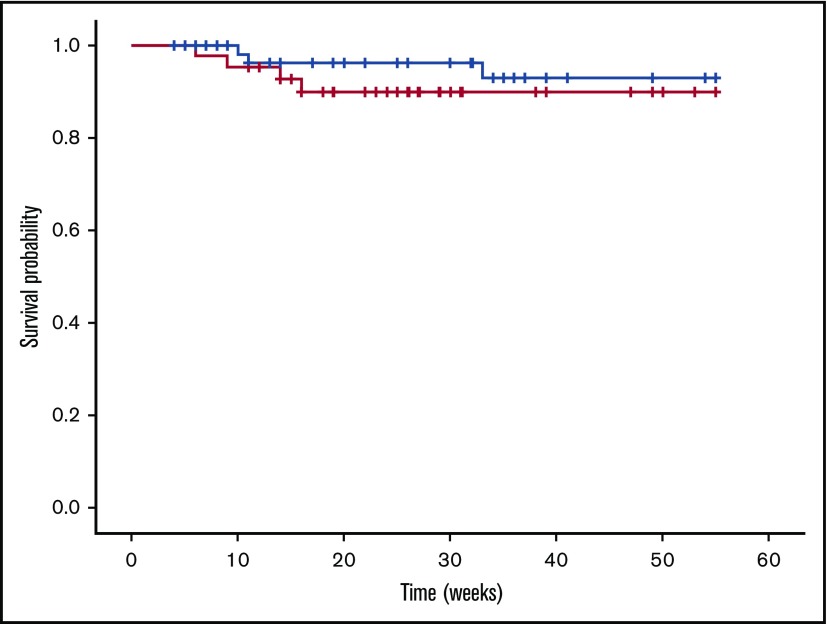
Figure 7.
Kaplan-Meier disease-free survival curves for TFPI_K1δ/δand TFPI_K1δ/+mice. TFPI_K1–deficient mice (red line) exhibit a probability of adverse event-free survival comparable to heterozygous controls (black line) (P = .37). Censored observations (animals removed from the study) are indicated as cross lines. Two out of 43 TFPI_K1δ/δ mice were found dead, and 2 others showed acute disease during the 14th and 16th weeks, but the probability of adverse event-free survival was not found to be significantly different from 73 controls of which 3 were found dead.

