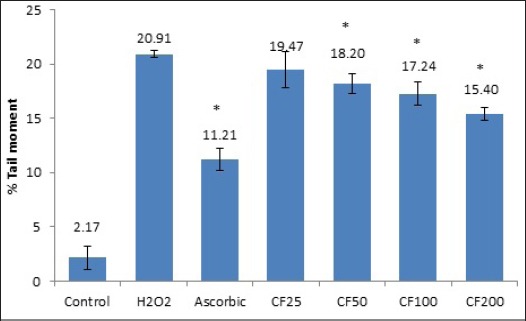
Figure 1.

Bars Chart Showed the Frequencies of Micronucleus in TK6 Cells after Exposure to Different Doses of CF Leaf Extracts Ranging from 25- 200 µg/ml. The control group was untreated-cells, whereas MMC bar or positive control group was 0.8 µg/ml of mitomycin C treatment. The bar having asterisks are significant different from positive control at p≤ 0.05.
