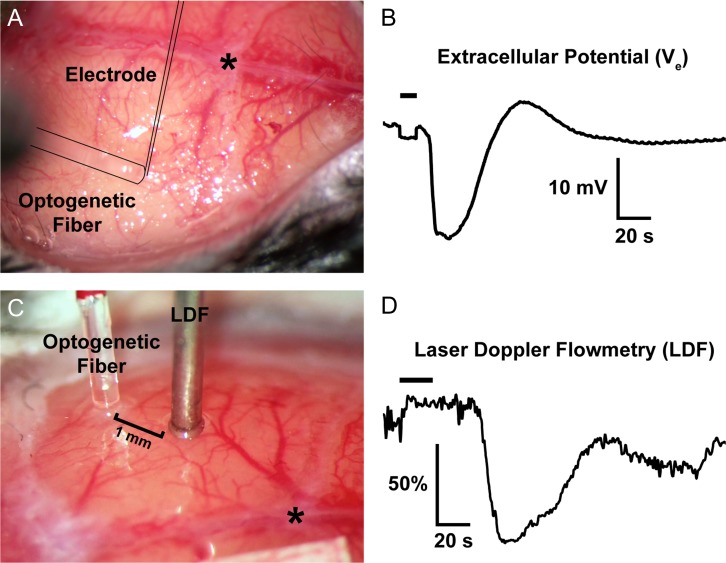
Figure 1.
Representative optogenetic SDs through the intact skull. (A,B) The optical fiber, out of focus in this image, is outlined, as is the glass micropipette inserted through a <100-μm burr hole next to the optical fiber to record the extracellular slow potential shifts (Ve) in the right whisker barrel cortex. (C,D) A laser Doppler probe (LDF) away from the optical fiber non-invasively detects the propagating blood flow changes associated with an SD that was optogenetically induced in left visual cortex. SD induction and subsequent propagating blood flow changes are also shown in the Supplemental Video at 20x speed. Horizontal bars on the tracings show illumination period. *, bregma.

