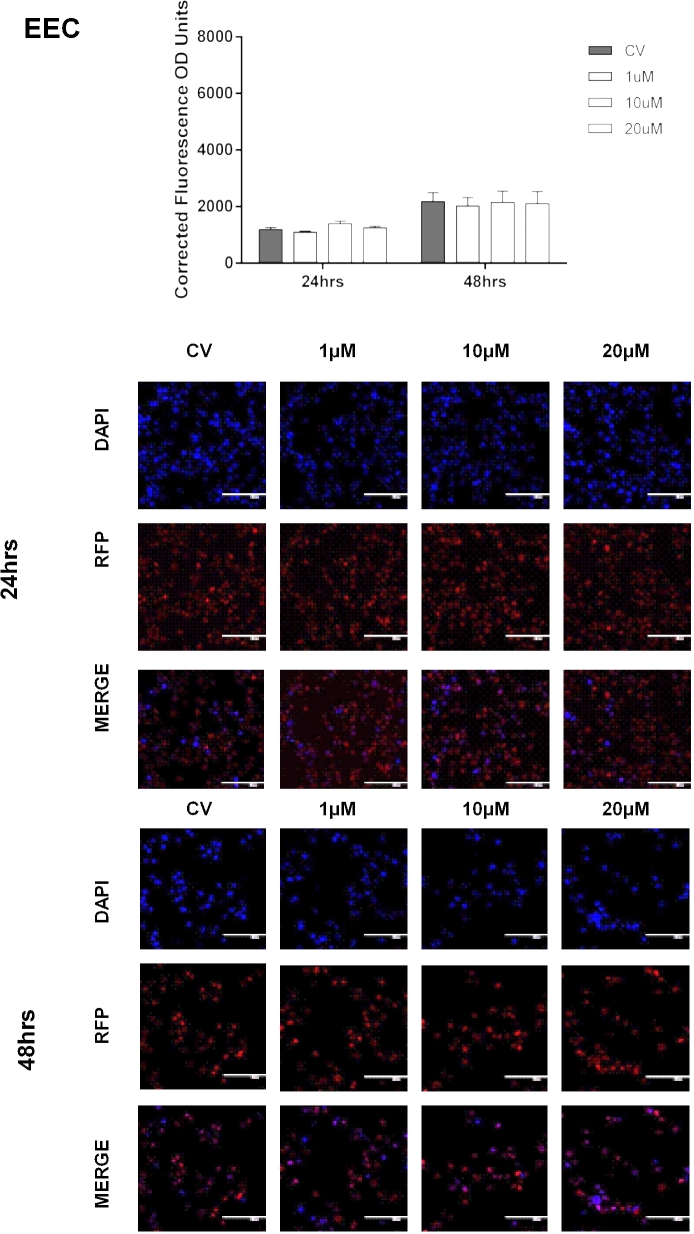
Figure 6.
Effect of EZH2 pharmacological inhibition in the enrichment of H3K27me3 in nonendometriotic epithelial cells (EEC). Cells were treated with GSK343 (1, 10, and 20 μM) for 24 and 48 h, respectively. Fluorescent intensity of H3K27me3 was detected by IF using a specific antibody against H3K27me3. Immunofluorescence intensity for H3K27me3 was measured at 48 h using Image J. H3K27me3 enrichment levels were determined using the CTCF formula. Low enrichment levels of H3K27me3 were detected when cells were treated with 20 μM at 24 h (P < 0.05 compared to CV) and 10 and 20 μM at 48 h (P < 0.05 compared to CV). Two-way ANOVA test followed by Tukey post hoc analysis was used for statistical analysis. Significance was set as P < 0.05. Representative pictures of DAPI (blue, which stain the nucleus), RFP (red, which stain H3K27me3 mark in the nucleus), and merge (DAPI and RFP) are shown to demonstrate the specificity of the antibody and the efficacy of the treatment.

