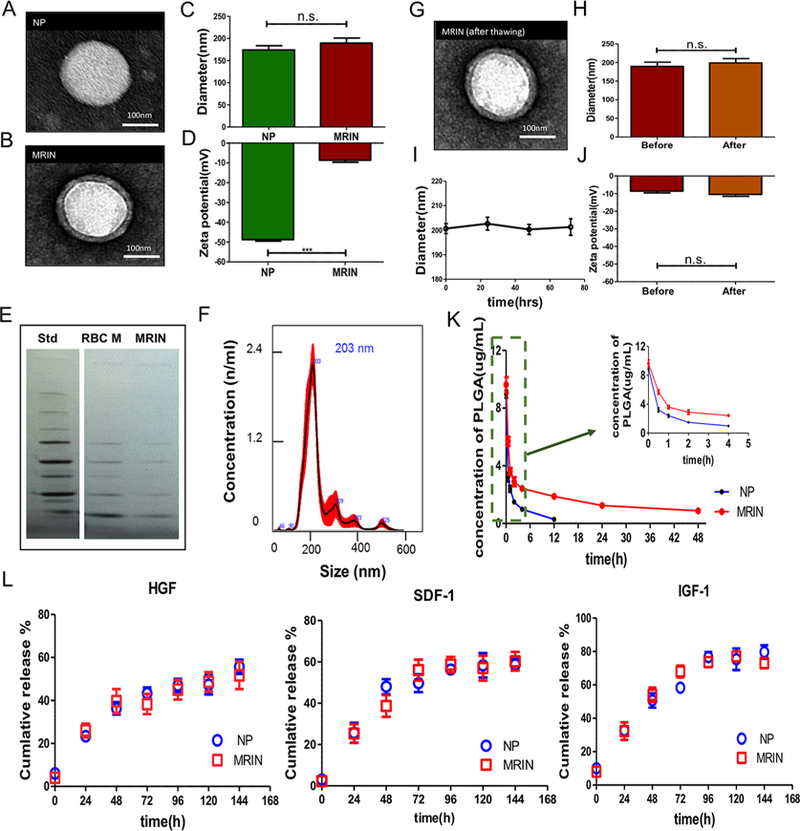
Figure 2.

Physiochemical and biological properties of MRINs. (A, B) TEM images of a NP and a MRIN. The NPs were negatively stained with uranyl acetate and subsequently visualized with TEM. (C) Diameters (nm) of NPs and MRINs measured by NanoSight (n = 4). (D) Zeta potential (mV) of NPs and MRINs (n = 3). (E) Images of SDS-PAGE gels examining protein contents of MRIN, which have similar protein bands as those observed from RBC membranes. (F) Size distribution of MRIN measured by NanoSight. The average size is approximately 200 nm. (G) A TEM image of a MRIN after freeze/thaw, showing the RBC coat is still intact. (H) Diameters (nm) of MRIN before and after freeze/thaw (n = 4). (I) Size change of MRINs after storage at room temperature (n = 3 for each time point). (J) Zeta potential (mV) of MRIN before and after freeze/thaw (n = 3). (K) Blood retentions of NPs and MRINs over a span of 48 h (n = 5). (L) Quantitative analyses on the releases of stromal cell-derived factor-1 (SDF-1), insulin-like growth factor-1 (IGF-1), and hepatocyte growth factor (HGF) from NPs and MRINs over time; n.s. indicated P > 0.05. Comparisons between any two groups were performed using two-tailed unpaired Student’s t test. Scale bars, 100 nm. All data are expressed the means ± SD.
