
Figure 3.
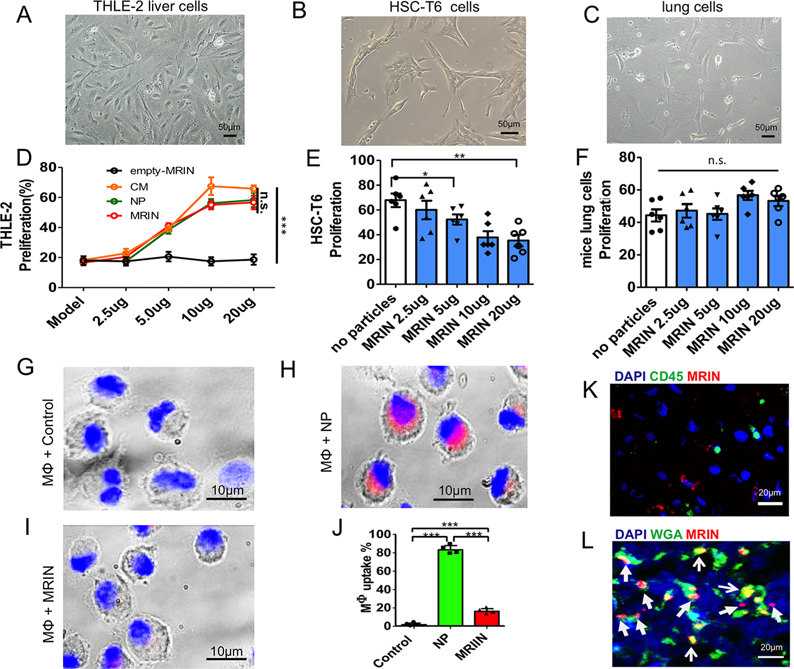
Effects of MRINs on liver, lung, and M1 macrophage cells. (A, B, C) Morphology of THLE-2 cells, HSC-T6 cells, and mouse lung cells indicated by white light microscopy. Scale bars, 50 μm. (D) Percentages of proliferating THLE-2 cells under various treatments (n = 6 for each group). (E, F) Proliferation of HSC-T6 cells and mouse lung cells under various concentrations of MRINs (n = 6 for each group). (G−I) Macrophage uptake of NPs and MRINs (red) after 3 h of co-incubation. Scale bars, 10 μm. (J) Quantitative analysis of the percentages of macrophages with particle endocytosis (n = 4 for each group). (K) Representative confocal microscopy image showing the minimal internalization of MRINs (red) by liver macrophages (green; stained with CD45). Scar bar, 20 μm. (L) Representative confocal microscopy image showing the location of MRINs (red) relative to liver cells (green; stained with WGA). Scar bar, 20 μm. * indicates P < 0.05; ** indicates P < 0.01; *** indicates P < 0.0001; n.s. indicated P > 0.05. Student’s t-test for comparison between two groups and one-way ANOVA for comparison among three and more groups. All data are expressed the means ± SD.