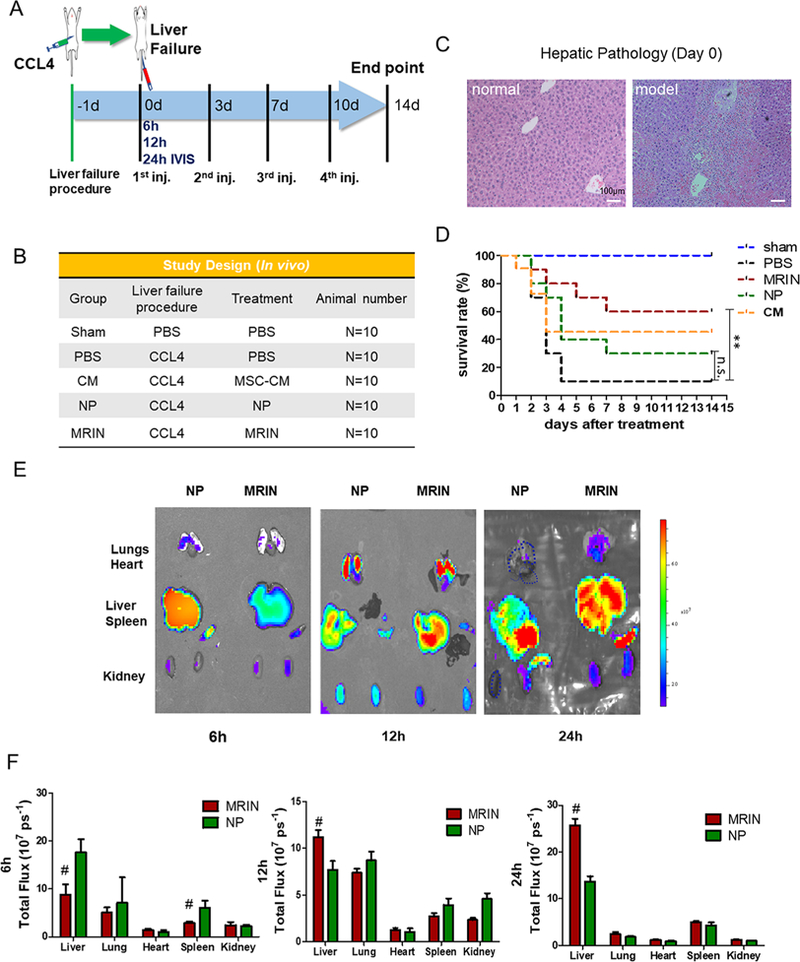
Figure 4.

Biodistrbution of MRINs and effects on animal survival. (A) Schematic showing the animal study design. (B) A tabular summary of study groups. (C) Liver histology after CCl4 treatment. H&E staining showing confluent necrosis of the hepatic lobules in model mice but not in normal mice. (D) Survival rates of animal in various groups (n = 10 animals per group). (E) Biodistributions of NPs and MRINs after systemic administration in mice with acute liver failure. Representative ex vivo fluorescent imaging of mouse organs (heart, lungs, liver, spleen and kidneys) at 6, 12, and 24 h post-intravenous NP and MRIN injections. (F) Quantitative analysis of fluorescent intensities (n = 3 animals per group). # indicates P < 0.01 when compared to NP group. Student’s t-test for comparison between two groups and one-way ANOVA for comparison among three and more groups. All data are expressed the means ± SD.
