
Figure 6.
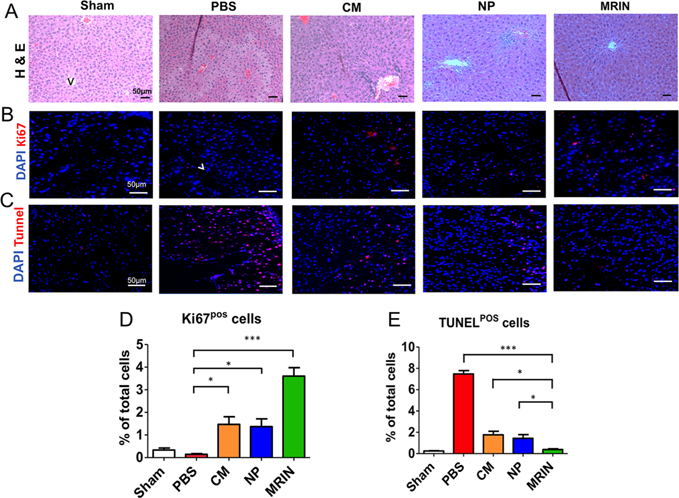
MRIN therapy promotes liver cell regeneration and inhibits cell death. (A) H&E staining of liver sections from different groups. Scale bars, 50 μm. (B) Representative fluorescent micrographs showing Ki67-positive cells (red nuclei). Scale bars, 50 μm. (C) Representative fluorescent micrographs showing TUNEL-positive cells (red nuclei). Scale bars, 50 μm. (D, E) Quantitation of proliferative and apoptotic cells (n = 3 for each group). * indicates P < 0.05; *** indicated P < 0.001. Student’s t-test for comparison between two groups and one-way ANOVA for comparison among three and more groups. All data are expressed the means ± SD.