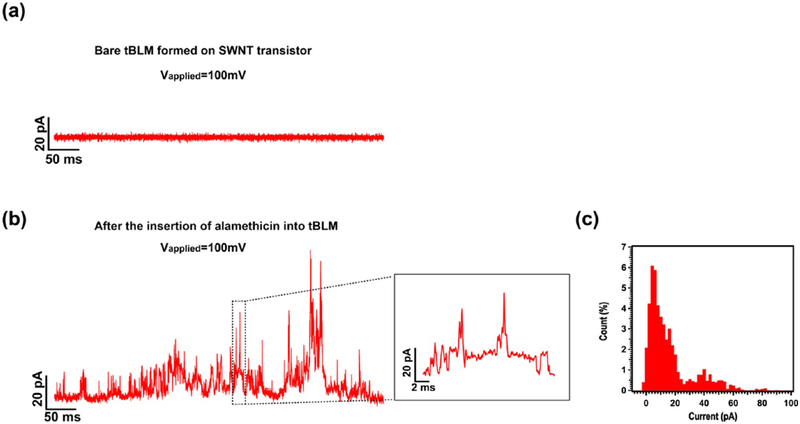
Figure 6.
Current traces before (a) and after incorporating alamethicin (b) into a tBLM on a SWNT transistor at an applied potential of +100 mV. The inset in (b) is the enlargement of the section of the current trace enclosed by a dashed rectangle. (c) The corresponding histogram of the current trace shown in (b). All traces were recorded at a sampling frequency of 10 kHz and cutoff frequency of 5 kHz. KCl (0.5 M) in 1× PBS solution was used for the recording.

