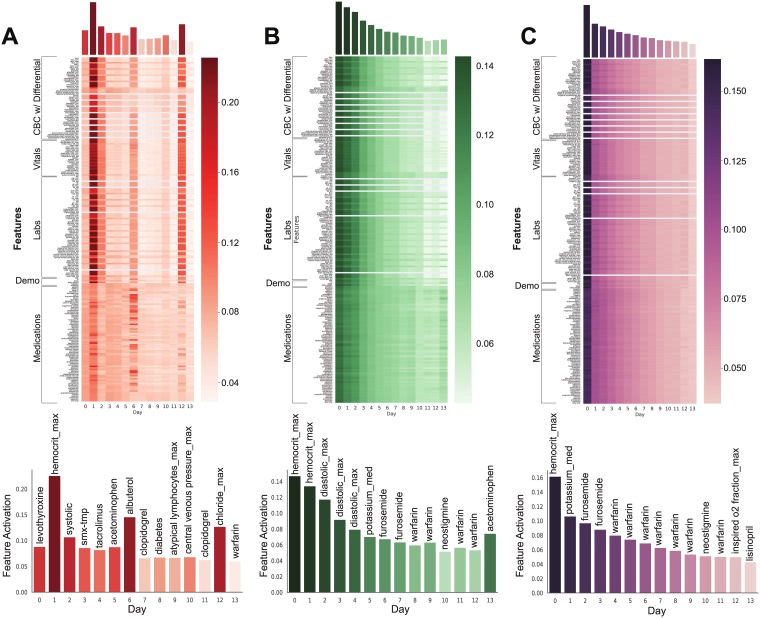
Fig 3. Attention heat maps averaged over all patients with daily attention and features with highest mean activation per day.
As described in “Extracting clinical information from average attention” in Methods, heatmaps are second order tensors produced by averaging over all patients. These patient-averaged heatmaps contain activations for each feature at each time step. One-dimensional feature-averaged activations are plotted above each heatmap and reveal days which were most highly attended to by the model. Lastly, each panel contains the activations for the feature which was most heavily attended to at every time step. The patient-averaged attention across all patients with (A) myocardial ischemia, (B) sepsis, and (C) vancomycin, demonstrates emphasis on early days, reflecting the fact that modeling initiation days are critical for making accurate predictions over the time series.

