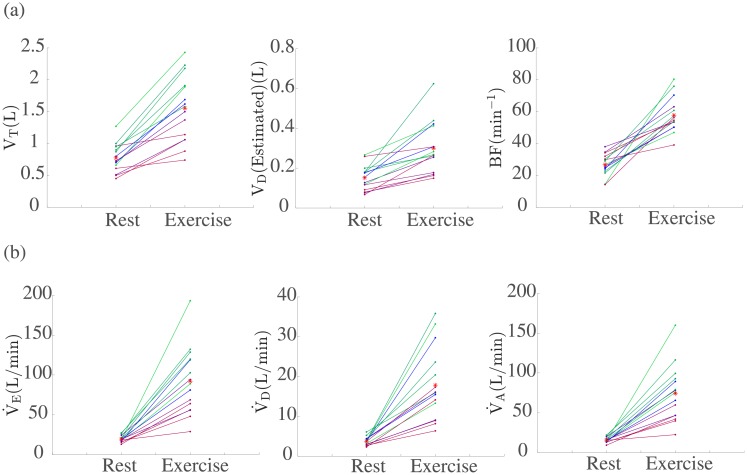
Fig 11.
(a) Tidal volume (VT), an estimate for the dead volume (VD) and Breathing frequency BF from the data. (b) Changes in ventilatory parameters during exercise for the 15 CF patients using the proposed form of = + a × W(t). In the case of the solid dots represent values extracted from the data, for and these represent values taken from model simulations (see S1 File). In all cases the red stars represent the group mean.

